1. Introduction
A standard approach to mitigating the spread of contagious diseases is to trace the contacts of those who test positive. To prevent the spread of the Coronavirus, entities from public health authorities, to large organizations like universities are using contact tracing (Centers for Disease Control and Prevention, 2020). To improve speed and breadth of tracing, digital contact tracing (via an app) is often a popular option (Ferretti, et al., 2020). For example, Australia (Australian Government Department of Health, 2020) and the EU (European Commission, 2020) started using voluntary contact tracing apps in April and May. However, there are several critiques of tracing apps focusing on the need protect individuals’ security, privacy, and information rights by design (ACM Europe Technology Policy Committee, 2020a, 2020b). In fact, after the Australian app was rolled out in April, by the second week in May Parliament had passed the Privacy Amendment (Public Health Contact Information) Act to support the COVIDSafe app and ensure users’ privacy was protected. In the United States debates about privacy risks and COVID risk simultaneously, we propose there is a need to better understand Americans’ privacy perceptions about data use during this pandemic (Australian Government Department of Health, 2020). In this study, we explore RQ: what privacy concerns Americans express during an on-going pandemic through a representative survey of American participants.
2. Related Work
2.1 Privacy Perception
Privacy is highly contextual. Previous studies suggest that people are willing to give up their information for tangible and intangible benefits (Grossklags and Acquisti, 2007; Castro and McLaughlin, 2019; Taylor, 2003), whereas other studies show significant willingness to pay for privacy (Gopavaram et al., 2020; Egelman et al., 2009). Prior research has identified variations in privacy perceptions as a function of participants’ awareness and knowledge of privacy practices (Liu et al., 2005; Malhotra et al., 2004); perceived control over information collection and usage (Castañeda and Montoro, 2007; Brandimarte et al., 2013); perceived sensitivity of information (Castañeda and Montoro, 2007); perceived regulatory protection from privacy harm (Dolnicar and Jordaan, 2006); risk perception (Garg and Camp, 2012); and the reputation of service providers (Teltzrow et al., 2007). Willingness to and comfort with disclosure has been found to be highly correlated or even predicated on perceptions of the ability of the data subject to control information disclosure, identified as the Control Paradox (Brandimarte et al., 2013). Control has also been identified as a determinant of risk perception for a wide range of physical risks (Weinstein, 1984). In our work, we conceptualized privacy as individuals’ ability to control information about themselves (Bhasin, 2006). Consequently, we queried participants’ comfort level about data sharing during COVID-19 for different purposes in different scenarios.
2.2 Risk Perception
Sacrificing individual privacy for the sake of national security is an enduring concept in the US, previously used to address bioterrorism plots (Annas, 2002) such as anthrax (Federal Bureau of Investigation) and also 9/11 (Solove, 2011). A similar approach has been suggested for addressing the Coronavirus and COVID-19, assuming that the severity of the COVID-19 pandemic is reason enough to eschew individual privacy concerns and share personal data to mitigate the spread of disease (Ross, 2020). Further underlying this assumption is protection-motivation theory, which suggests fear is a motivating factor for people to seek protective behaviors (Johnston and Warkentin, 2010; Herath and Rao, 2009). Such fear appeals are influenced by people’s perceived severity of the risks (Johnston and Warkentin, 2010). Thus due to COVID-19, people’s perceived personal risk of infection and disease severity might motivate them to adopt contact tracing apps, despite privacy loss. The other two factors that influence fear appeal are self-efficacy (i.e., are participants able to take action to mitigate risk) and response efficacy (i.e., are such actions effective) (Johnston and Warkentin, 2010).
Risk perceptions are rarely the result of purposeful calculus. Studies found that people are likely to be unrealistically optimistic about risks that are under volitional control and those that are familiar (Nordgren et al., 2007), reifying and extending the Control Paradox. Conversely, risk perception increases when risks are new and uncontrollable, such as emerging infectious diseases (Sjöberg, 2000; Slovic P. E., 2000; Weinstein, 1988; Weinstein, 1984). Therefore, it is arguable that perceptions of COVID-19 risks are unrealistically high and result in unnecessary exposure to the more familiar privacy risk through protection-seeking behaviors (e.g., adopting contact tracing apps). We evaluated this possibility by exploring participants’ comfort with data sharing and how this interacts with their health risk and privacy risk perceptions in our experiment.
2.3 Other Factors Potentially Applicable to COVID-19
In 2003, SARS was a new infectious disease like COVID-19. Studies on SARS found global differences in risk perceptions. For example, in some Asian countries perceived risk from SARS was lower than in the US (Blendon et al., 2004; Lau et al., 2003). Conversely, one current cross-national study showed that contact tracing could be acceptable to all the participants with only slight national differences. Specifically for COVID-19, the results from Altmann et al.’s survey of participants in France, Germany, Italy, the UK, and the US found the least acceptance in the US and Germany (Altmann, et al., 2020). To eliminate cultural influences in our study, we only focus on the American population’s perceptions.
Furthermore, the Altmann et al. survey identified a group of concerns around trust in government, privacy, and security (Altmann, et al., 2020). In addition to these concerns, other research suggests that perceived regulatory protection from harm (Dolnicar and Jordaan, 2006) and service providers’ reputation also influence privacy concerns (Teltzrow et al., 2007). To address these factors, we evaluate participants’ trust in law enforcement, healthcare providers, and major technology providers by capturing participants’ privacy concerns in sharing data with these entities. This is embedded in our first hypothesis as detailed in 2.4.
2.4 Research Question
The goal of our research is to explore the privacy concerns Americans express during an on-going pandemic. To address this question, we explored the following hypotheses:
H1) Participants’ privacy preferences remain the same whether the information they give is used for public health in the midst of a public health crisis (e.g., COVID-19).
H2) Participants’ privacy preferences are a function of risk perceptions
3. Methodology
In this survey, we chose a quantitative approach to capture participants’ perceived comfort with data collection and data sharing, as well as their privacy risk and health risk perceptions. Our online survey approach offers flexibility, time efficiency, ease-of-launch, broader recruitment capability, ease-of-analysis (Evans and Mathur, 2005), and aligns with social distancing. Previous studies of privacy preferences have found online surveys to be more representative than a census panel (Redmiles et al., 2019) and that even small samples are indistinguishable from a random market sample (Momenzadeh et al., 2020).
3.1 Survey Design
In this survey, we used participants’ comfort with data collection and sharing as an indicator of their privacy preferences, as done previously by Naeini (2017). Participants were randomly assigned to one of two groups: General or Health. Each participant was shown three scenarios, as shown in Table 1. In the General group, the data are used to “provide personalized services, recommendations, and conveniences,” whereas in the Health Group, the data are to “contain the spread of an infectious disease.” The scenarios are based on three devices (Smartphone, Security Camera, and Fitness tracker). Our goal was to measure: 1) the difference between whether data is used for public health purposes (H1); and 2) the relationship between their privacy preferences and risk perceptions (H2).
Table 1. Scenario Descriptions by Group Assignment
| Scenario | General | Health |
| 1 | When you go outside (e.g., for a walk or run), your smartphone logs your movement data (including time, steps, and location). This data is used to provide personalized services, recommendations, and conveniences. | When you go outside (e.g., for a walk or run), your smartphone logs your movement data (including time, steps, and location). This data is used to contain the spread of a contagious disease by tracing social encounters with people in the neighborhood who tested positive for the disease. |
| 2 | At home, your security camera records the view of the street in front of your house. This data is used to provide personalized services, recommendations, and conveniences. | At home, your security camera records the view of the street in front of your house. This data is used to contain the spread of a contagious disease by tracing social encounters with people in the neighborhood who tested positive for the disease. |
| 3 | When you go outside (e.g., for a walk or run), your smartwatch/fitness tracker logs your movement data (including time, steps, and location). This data is used to provide personalized services, recommendations, and conveniences. | When you go outside (e.g., for a walk or run), your smartwatch/fitness tracker logs your movement data (including time, steps, and location). This data is used to contain the spread of a contagious disease by tracing social encounters with people in the neighborhood who tested positive for the disease. |
Note. The General group in this chart is the control group.
The study started with the study information sheet, and then the scenarios followed, presented in random order. Scenarios were randomized to eliminate potential ordering bias (Brace, 2008). Each scenario was followed by questions asking participants to rate their level of comfort with data collection and sharing. Participants choose on a five-point scale: 1-Extremely uncomfortable, 2-Uncomfortable, 3-Neutral, 4-Comfortable, 5-Extremely uncomfortable. We then interrogated participants’ risk perceptions. To capture participants’ privacy risk perception and health risk perception, we relied on the standard nine-dimension Risk Perceptions Scale (Fischhoff et al., 1978). This scale is often used in offline risk perception evaluations (Slovic et al., 1980; Grunert, 2005) and has been used online as well. We made subtle changes in these classic nine-dimensional risk questions, changing generic “risk” to specify either “privacy risk” or “risk of infectious diseases” (See Appendix A). Below, we detail the nine dimensions and specify our changes. For voluntariness we specified, “Is your exposure to the risks of [privacy loss/infectious diseases] in your control (voluntary risk), or out of your control (involuntary risk)? With answers from 1 = voluntary to 5 = involuntary. Similarly for immediacy we customized it to, “Is the impact of [exposing your private information/being exposed to an infectious disease] immediate, or does it happen at a later point in time (delayed risk)?”. For both knowledge to exposed and knowledge to science we changed generic risk to “understand the consequences of [privacy loss/infectious diseases]?” Given the importance of the Control Paradox, controllability was refined to, “To what extent do you have control over the consequences of [privacy loss/infectious diseases]?” with options for answers from 1 as “complete control” to 5 meaning “no control.” Newness was unchanged (i.e., “Are these risks new, novel ones, or old, familiar ones?”). Chronic-catastrophic was unaltered and remained, “Is this a risk that effects people one at a time (chronic risk), or a large number of people at once (catastrophic risk)?”; as was Common-Dread which remained, “Is this a risk that you have learned to live with and can think about reasonable calmly (common risk), or is it one that you dread on the level of a gut reaction (dreadful risks?)”. Severity of Consequences was slightly customized from the standard query into, “how severe are the consequences of [privacy loss/infectious diseases]?”.
After querying about general risk perception using the standard nine-dimensional scale, we evaluated participants’ computer expertise. Here we used the Expertise Measurement Scale (Ravijan et al., 2017), reformatted into two multiple-choice questions. The scale consists of skills and knowledge-based questions about computer and security expertise.
To evaluate the participants’ knowledge of health risk, we developed questions using the CDC’s recommendations for preventing respiratory viral infections (CDC, 2019a, 2019b, 2019c). Then we repeated Fischhoff et al.’s nine-dimension scale (Fischhoff et al., 1978) to evaluate health risk perceptions. We closed with demographics questions. A flowchart of our survey design can be seen in Figure 1. Survey Questions can be seen in Appendix A.
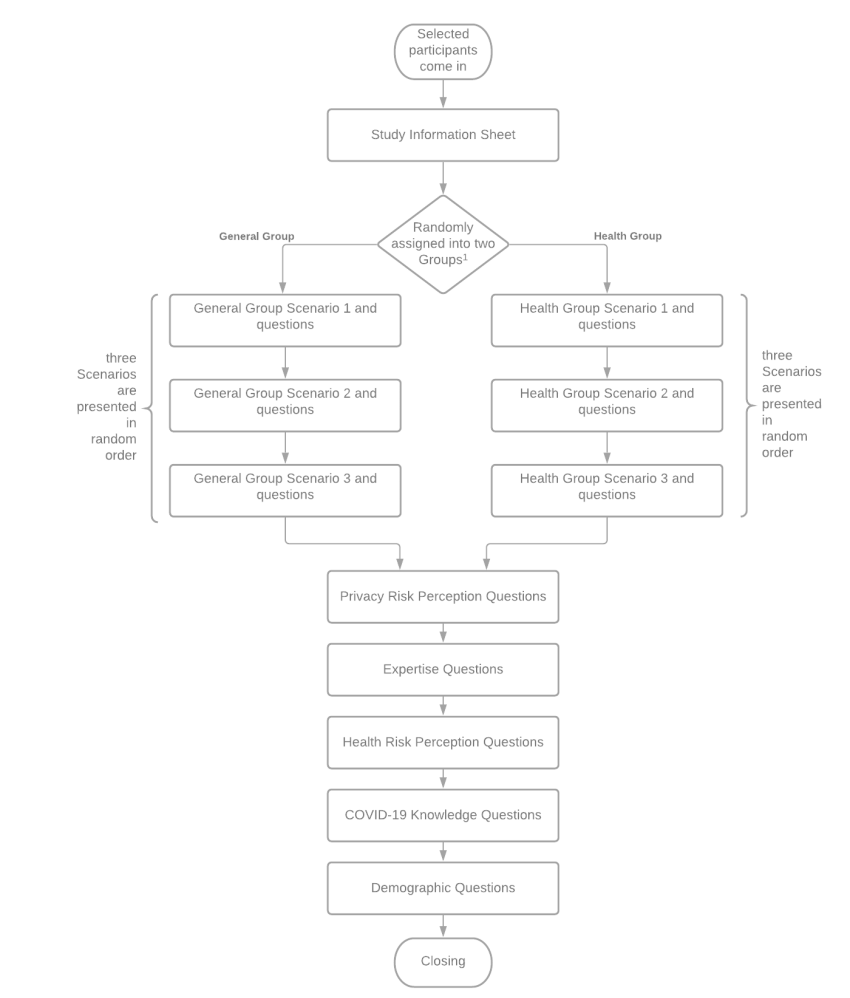
Figure 1. Survey Design Flowchart
Note. We relied on the Qualtrics randomizer to, “randomly assign participants” to ensure an even distribution by demographic category.
We also had two attention check questions to ensure valid responses, per best practices (Hauser and Schwarz, 2016). These questions are obvious queries unrelated to the study, e.g., “paying attention is important in our survey, please select ‘strongly disagree’ in this question.”
3.2 Participant Recruitment
The survey was designed using Qualtrics. Before deploying the survey, we conducted a pilot study with ten university students to test the correctness and effectiveness of the questions. Upon our University Institutional Review Board (IRB) ’s approval, we deployed the survey through Prolific on April 28th, 2020 and paid each participant $3. These payments were calculated based on a $15 an hour living wage and the assumption that the survey could be completed in 10-12 minutes. Prolific provided us a representative sample of adults in the US, which reflects the demographic distribution of American population based on the US Census Bureau.[1]
The first page of the survey contained the study information sheet detailing participant rights, including confidentiality and withdrawal measures. The survey was live until May 2nd and we received complete responses from 291 participants. We rejected responses from 17 participants because they completed the survey in fewer than 5 minutes (Smith et al., 2016), and/or they had exact same answers to all questions. In addition, we rejected responses from 13 participants because they failed the attention check questions. In the end, we had 261 valid responses (130 in General Group; 131 in Health Group) with equivalent demographics in both groups. The total response rate was 261/291 = 89.69% (≥ 80%) which is considered acceptable (Fincham, 2008). Detailed demographic information can be found in Table 2.
Table 2. Sociodemographic Characteristics of Participantsn | % | |
Gender | ||
Male | 126 | 48.28 |
Female | 128 | 49.04 |
|
Non-binary |
6 |
.02 |
|
No answer |
1 |
|
|
Education |
||
|
Less than a high school diploma |
4 |
.02 |
|
High School degree or equivalent |
72 |
27.58 |
|
Associate’s degree (e.g., AA, AS) |
30 |
11.49 |
|
Bachelor’s degree (e.g., BA, BS) |
101 |
38.69 |
|
Graduate or professional degree (e.g., MA, MD, PhD) |
44 |
16.85 |
|
Other (freelancer, self-employed) |
9 |
3.45 |
|
Prefer not to say |
1 |
|
|
Annual Income |
||
|
<$10K |
20 |
7.66 |
|
$10K – $40K |
72 |
27.58 |
|
$40K – $70K |
81 |
31.03 |
|
$70K – $100K |
43 |
16.47 |
|
>$100K |
41 |
15.70 |
|
Prefer not to say |
4 |
.02 |
|
Employment Status |
||
|
Part-time/Full-time employed |
39 |
14.94 |
|
Not in the labor force (e.g., retired, homemaker) |
31 |
11.88 |
|
Unemployed and looking for work |
33 |
12.64 |
|
Student |
30 |
11.49 |
|
Other |
26 |
9.96 |
|
Prefer not to say |
2 |
|
|
People in Household |
||
|
With kids (<18 years old) |
81 |
31.03 |
|
With Seniors (>65 years old) |
61 |
23.37 |
Note. N = 261. Participants were on average 37 years old (SD = 12.90).
3.3 Data Analysis
We performed data analysis using R for factor analysis and Python for all additional analysis after exporting the data from Qualtrics. Initial exploration included evaluation of distributions for age, comfort levels, and calculation of Risk Perception. Finally, we conducted the analysis described below to evaluate H1) and H2). This analysis and the subsequent findings are in the next section.
4. Findings
In this section, we present our data analysis results.
4.1 Differences between General and Health Groups
As mentioned in Section 3, we queried participants about their comfort with data collection and sharing in this survey. To test H1, we first summarized the participants’ responses using boxplots and found a sizeable difference between the General and Health groups (see Figures 2-5). We then conducted a Wilcoxon rank-sum test on each scenario to explore the significance of the difference between the General Group and the Health Group. The Wilcoxon rank-sum test assumes the data from two separate groups on a dependent variable have the same distribution but does not require the samples to be normally distributed (McKnight and Najab, 2010). For each of the three scenarios, we compared the distribution of responses of the two groups. Thus, H1 would be rejected if any of the Wilcoxon rank-sum tests showed statistical significance.
4.1.1 Participants’ comfort with data collection
We first conducted a Wilcoxon rank-sum test on participants’ comfort with data collection. Figure 2 shows apparent sizable between-group differences in Scenarios 2 and 3, but these are not statistically significant. In fact, the results show no statistical significance in between-group differences in any of the Scenarios (see Table 3). Thus, we cannot reject the null hypothesis that participants’ comfort with data collection from two groups are the same.
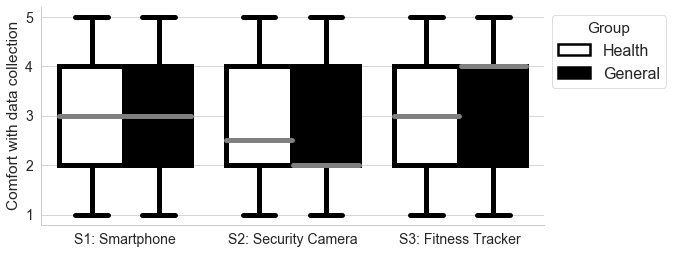
Figure 2. Comfort with Data Collection by Scenario
Note. This figure demonstrates the differences in participant comfort with data sharing by scenario and group assignment (General or Health). Scenario 1 (S1) was for Smartphone data, Scenario 2 (S2) for Security Camera data, and Scenario 3 (S3) for Fitness Tracker data. Comfort with data sharing for each individual device type by data recipient and group assignment is shown in Figures 3 through 5.
Table 3. Wilcoxon Rank Sum Test of Comfort with Data Collection by Participant Group
|
|
General Group |
Health Group |
Variable |
||
|
|
Median |
SD |
Median |
SD |
p |
|
Scenario 1 |
3.0 |
1.207 |
3.0 |
1.965 |
0.767 |
|
Scenario 2 |
2.0 |
1.293 |
2.5 |
1.269 |
0.957 |
|
Scenario 3 |
4.0 |
1.227 |
3.0 |
1.209 |
0.313 |
4.1.2 Participants’ comfort with data sharing
In the survey, we queried participants’ comfort with sharing their data with five distinct entities: Law enforcement, Healthcare providers, Health insurance companies, Third-party private companies, and Device Manufacturers. Participant responses showed a sizable between-group difference for the Healthcare provider and Health insurance company in Scenario 1; between Law enforcement, Healthcare provider, and Third-party private companies in Scenario 2; and between Healthcare provider, Health insurance company, Device Manufacturer, and Third-party private companies in Scenario 3 (See Figures 3-5).
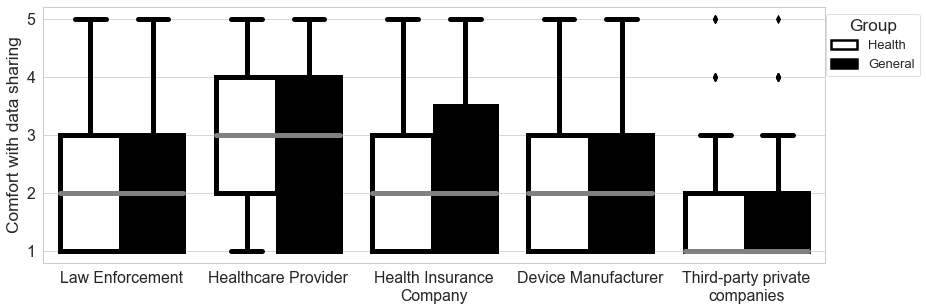
Figure 3. Comfort with Sharing Smartphone Data (Scenario 1) by Data Recipient
Note. This figure demonstrates the differences in comfort with sharing smartphone data with five data recipients by group assignment.
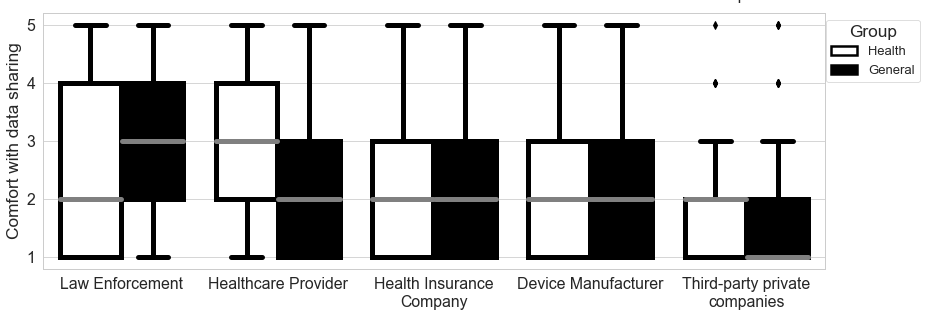
Figure 4. Comfort with Sharing Security Camera Data (Scenario 2) by Data Recipient
Note. This figure demonstrates the differences in comfort with sharing security camera data with five data recipients by group assignment.
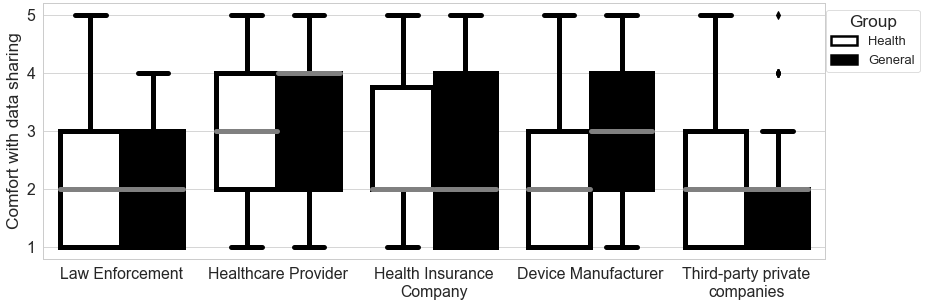
Figure 5. Comfort with Sharing Fitness Tracker Data (Scenario 3) by Data Recipient
Note. This figure demonstrates the differences in comfort with sharing fitness tracker data with five data recipients by group assignment.
We conducted Wilcoxon rank-sum tests to explore whether these between-group differences were statistically significant. We found significant between-group differences for Law enforcement and Healthcare provider in Scenario 2. Specifically, for Law Enforcement, the privacy preference in General Group (Median = 3.0) reflects greater comfort in sharing data than in the Health Group (Median = 2.0) given p = .004, statistic = 2.895. Conversely for Healthcare Provider, the privacy preference in Health Group (Median = 3.0) indicates greater comfort than the General Group (Median = 2.0) given p = .000, statistic = -4.031. These are the only two significant between-group differences. Thus while the compilation of data resulted in similar comfort levels (as shown in 4.1.1), there was significant difference based on data sharing in two cases and, counter-intuitively, in opposite directions.
4.1.3 Participants’ risk perceptions
We also tested if there was any statistically significant between-group difference among participants’ privacy and health risk perceptions. We compared the differences between the two groups by implementing a Wilcoxon rank-sum test between the dimensions of privacy risk perceptions and the dimensions of health risk perceptions. We identified no significant differences.The results illustrated in the boxplots (Figure 2-5) and evaluated with rank-sum tests (Table 3) show no significant differences in people’s privacy preference regardless of if the data are for compiled for public health or general commerce. Further, we see no statistical differences in their risk perceptions. As noted in the section above, there are differences in terms of sharing the data once it is compiled.
4.2 Risk Perception Factors Impacting Comfort Level
We leveraged Exploratory Factor Analysis and Regression Analysis to derive the relation between risk perception dimensions and participants’ privacy preferences about data collection and sharing to test H2. Previous work has shown this dimensional analysis can explain significant variance in privacy risk perceptions (Garg and Camp, 2012).
4.2.1 Exploratory Factor Analysis (EFA)
We first performed EFA to extract factors from the nine dimensions of privacy risk perception and the nine dimensions of health risk perceptions, with principal component analysis (PCA) for factor extraction. Snook and Gorsuch (1989) show that with larger samples (i.e., N ≥ 200) PCA and other approaches have similar results. The number of participants (N = 261) was adequate to obtain quality in the factor solution (Kline, 2014). The result from the Barlett’s test confirmed that the correlation matrix came from a population of independent samples (privacy risk dimensions: x2 (36) = 197.78, p < .001; health risk dimensions: x2 (36)= 268.58, p < .001), further indicating that the factor analysis was appropriate. Our analysis indicated no significance in between-group comparisons of the means of participants’ risk perceptions (Section 4.1). Similarly, we found no significant differences in the factor analysis.Based on the result of parallel analysis and PCA eigenvalues, we retained four factors. We used oblique rotation to ensure orthogonality of these factors. Together these four factors could explain more than 60% of the variance.
The EFA results (see Tables 4a and 4b) show that for health and privacy there is an “Autonomy” factor consisting of Voluntariness and Control. The “Familiarity” factors consist of dimensions that are related to the understanding of the risk (Exposed and Science), while the “Newness” factor consists entirely of the Newness dimension. The “Impact” factor in privacy risk perception consists of Common and Severity dimensions. In health risk perception, the “Impact” factor also includes the Chronic dimension. The specific eigenvalue of each factor and the percentage of variances they accounted for are listed in Tables 4a and 4b for privacy and health, respectively.
Table 4a. Results from Factor Analysis of 9 Dimensions of Privacy Risk Dimensions
|
Privacy Risk Dimension |
Factor Loading |
||||||||
|
|
1 |
2 |
3 |
4 |
5 |
6 |
7 |
8 |
9 |
|
149. Voluntary |
0.721 |
|
|
|
|
|
|
|
|
|
150. Immediacy |
|
|
|
|
|
-0.247 |
0.156 |
|
|
|
152. Exposure |
|
0.550 |
|
|
|
|
|
|
|
|
151. Science |
|
|
|
0.433 |
|
|
|
|
|
|
154. Control |
0.722 |
|
|
|
|
|
|
|
|
|
153. Newness |
|
|
|
|
|
0.461 |
|
|
|
|
155. Chronic |
|
0.288 |
|
-0.120 |
0.147 |
|
|
0.151 |
|
|
156. Common |
|
|
0.639 |
|
|
|
|
|
|
|
157. Severity |
|
|
0.673 |
|
|
|
|
|
|
Note. N = 261. The extraction method was Exploratory Factor Analysis (EFA). The relevant survey question number is listed before the Privacy Risk Dimension.
Table 4b. Results from Factor Analysis of 8 Dimensions of Health Risk Dimensions
|
Health Risk Dimension |
Factor Loading |
|||||||
|
|
1 |
2 |
3 |
4 |
5 |
6 |
7 |
8 |
|
149. Voluntary |
|
|
|
|
0.644 |
|
|
|
|
150. Immediacy |
|
|
|
0.611 |
|
|
|
|
|
152. Exposure |
|
0.370 |
|
|
|
|
|
0.327 |
|
151. Science |
|
0.821 |
|
|
|
|
|
|
|
154. Control |
|
|
0.814 |
|
|
|
|
|
|
153. Newness |
|
|
|
|
|
|
0.631 |
|
|
155. Chronic |
0.352 |
|
|
|
|
|
|
|
|
156. Common |
|
|
|
|
|
0.437 |
|
|
|
157. Severity |
0.765 |
|
|
|
|
|
|
|
Note. N = 261. The extraction method was Exploratory Factor Analysis (EFA). The relevant survey question number is listed before the Health Risk Dimension.
As shown in Tables 4a and 4b, the four factors in privacy risk perceptions accounted for 61.06% of the total variance. The four factors in health risk perceptions accounted for 64.41% of the total variance in risk perception of sharing different types of information in different Scenarios. The result was eight factors: Health_Autonomy, Privacy_Autonomy, Health_Familiarity, Privacy_Familiarity, Health_Newness, Privacy Newness, Health_Impact, and Privacy_Impact.
4.2.2 Regression Analysis
We tested the correlation between the eight reduced factors from health/privacy risk perceptions before performing regression analysis. The result suggests that none of the reduced factors can be collapsed into one, given all r ≤ .5 for each pair of factors. We then performed linear regression analysis to test the relationship between reduced risk perception factors and participants’ privacy preferences.
4.2.2.1 Participants’ comfort with data collection vs. risk perceptions
We conducted three regression analyses, one for each scenario. In each analysis, participants’ comfort with data collection was used as dependent variables, whereas the eight reduced risk perception factors were used as independent variables.The results (see Tables 5a-c) indicate that Privacy_Autonomy and Privacy_Impact in privacy risk perception are statistically significant in predicting participants’ comfort with data collection in all 3 scenarios (p ≤ .05). The positive coefficients of Privacy_Autonomy across all 3 scenarios indicate that participants perceived Privacy_Autonomy is positively correlated with increased comfort with data collection. The coefficient is greatest in Scenario 2 (B = .2567) followed by Scenario 1 (B = .1402) and Scenario 3 (B = .1068). On the other hand, the negative coefficients of Privacy_Impact across all three scenarios indicate that participants’ perception of an increased impact of privacy loss is correlated with a lower comfort level with data collection.
Table 5a. Regression Analysis of Comfort with Data Collection via Smartphone (Scenario 1) with Reduced Factors
|
Effect |
Estimate |
SE |
t |
p |
|
Fixed effects |
|
|
|
|
|
Intercept |
3.4800 |
0.3626 |
9.60 |
2e-16 |
|
Privacy_Autonomy |
0.1402 |
0.0536 |
2.62 |
0.0094 |
|
Privacy_Impact |
-0.3602 |
0.0595 |
-6.05 |
5e-09 |
|
Health_Newness |
0.1705 |
0.0505 |
2.13 |
0.0340 |
Note. Only factors that were statistically significant are listed in the table. R2=0.183.
Table 5b. Regression Analysis of Comfort with Data Collection via Security Camera (Scenario 2) with Reduced Factors
|
Effect |
Estimate |
SE |
t |
p |
|
Fixed effects |
|
|
|
|
|
Intercept |
3.1136 |
0.3695 |
8.43 |
2.5e-15 |
|
Privacy_Autonomy |
0.2567 |
0.0570 |
4.50 |
1.0e-05 |
|
Privacy_Impact |
-0.3044 |
0.0634 |
-4.80 |
2.7e-06 |
Note. Only factors that were statistically significant are listed in the table. R2=0.177.
Table 5c. Regression Analysis of Comfort with Data Collection via Fitness Tracker (Scenario 3) with Reduced Factors
|
Effect |
Estimate |
SE |
t |
p |
|
Fixed effects |
|
|
|
|
|
Intercept |
4.3711 |
0.3510 |
12.45 |
2e-16 |
|
Privacy_Autonomy |
0.1068 |
0.0542 |
1.97 |
0.05 |
|
Privacy_Impact |
-0.4023 |
0.0603 |
-6.68 |
1.5e-10 |
Note. Only factors that were statistically significant are listed in the table. R2=0.181.
The Health_Newness factor also appeared to be statistically significant in Scenario 1. The positive coefficient indicates that Health_Newness is correlated with increased comfort with data collection by Smartphone (Scenario 1).
4.2.2.2 Participants’ comfort with data sharing
We then performed regression to derive the relation between reduced risk perception factors and participants’ comfort with sharing data with five entities: Law enforcement, Healthcare provider, Health Insurance company, Device manufacturer, and Third-party private companies. We conducted three multivariate regressions for three scenarios to evaluate the relationship between the reduced risk factors and each entity.The results of all three analyses are shown in Tables 6a-c. This indicates that Privacy_Impact was not statistically significant in all scenarios across all five entities. The consistent negative coefficients indicate that, in general, participants tend to be more comfortable sharing their data when the impact of privacy risk is less serious. Privacy_ Autonomy was statistically significant in nearly all Scenarios across all five entities, except for Law enforcement in Scenario 1 and 3 (Table 6a and 6c); and for Healthcare provider in Scenario 2 (Table 6b). The consistent positive coefficients imply that participants tend to be more comfortable sharing their data when they perceive a higher level of autonomy.
Table 6a. Multivariate Regression Analysis of Comfort with Smartphone Data by Entity Using Reduced Factors|
|
Law enforcement |
Healthcare provider |
Health insurance company |
Device manufacturer |
Third party |
||||||||||
|
Variable |
B |
SE |
p |
B |
SE |
p |
B |
SE |
p |
B |
SE |
p |
B |
SE |
p |
|
Intercept |
2.21 |
0.35 |
2.0e-09 |
3.02 |
0.42 |
1.3e-11 |
1.63 |
0.38 |
2.4e-05 |
3.21 |
0.38 |
1.6e-15 |
2.10 |
0.29 |
2.4e-12 |
|
Privacy Autonomy |
|
|
|
0.13 |
0.06 |
0.037* |
0.28 |
0.06 |
7.9e-07** |
0.02 |
0.06 |
0.72 |
0.18 |
0.04 |
1.6e-5* |
|
Privacy Impact |
-0.26 |
0.06 |
9.2e-06** |
-0.18 |
0.07 |
0.008** |
-0.16 |
0.06 |
0.01 |
-0.29 |
0.06 |
3.4e-6** |
-0.27 |
0.05 |
8.6e-9* |
|
Health Autonomy |
0.18 |
0.06 |
.001** |
0.11 |
0.06 |
0.055 |
0.14 |
0.05 |
0.006** |
0.13 |
0.05 |
.02* |
0.07 |
0.04 |
.045* |
|
Health Newness |
0.13 |
0.05 |
.007** |
|
|
|
|
|
|
|
|
|
|
|
|
|
Health Familiarity |
|
|
|
|
|
|
|
|
|
|
|
|
|
|
|
Note. This regression was completed using data from Scenario 1. *p<.05, **p<.01
Table 6b. Multivariate Regression Analysis of Comfort with Security Camera Data by Entity Using Reduced Factors
|
|
Law enforcement |
Healthcare provider |
Health insurance company |
Device manufacturer |
Third party |
||||||||||
|
Variable |
B |
SE |
p |
B |
SE |
p |
B |
SE |
p |
B |
SE |
p |
B |
SE |
p |
|
Intercept |
3.14 |
0.43 |
3.6e-12 |
2.53 |
0.40 |
1.6e-9 |
1.74 |
0.36 |
3.4e-06 |
2.69 |
0.36 |
1.2e-12 |
2.22 |
0.28 |
1e-13 |
|
Privacy Autonomy |
0.16 |
0.06 |
0.013* |
0.10 |
0.06 |
0.07 |
0.22 |
0.05 |
1.0e-5** |
0.15 |
0.05 |
.005** |
0.13 |
0.04 |
.002** |
|
Privacy Impact |
0.30 |
0.07 |
3.4e-05** |
-0.20 |
0.07 |
0.003** |
-0.23 |
0.06 |
0.0001** |
-0.30 |
0.06 |
6.3e-7** |
-0.26 |
0.04 |
6.5e-8** |
|
Health Autonomy |
|
|
|
|
|
|
|
|
|
|
|
|
|
|
|
|
Health Newness |
0.10 |
0.06 |
.007** |
0.18 |
0.06 |
0.001** |
0.23 |
0.05 |
1.1e-5** |
0.14 |
0.05 |
.005** |
0.07 |
0.04 |
0.09* |
|
Health Familiarity |
|
|
|
|
|
|
|
|
|
|
|
|
|
|
|
Note. This regression was completed using data from Scenario 2. *p<.05, **p<.01
Table 6c. Multivariate Regression Analysis of Comfort with Fitness Tracker Data by Entity Using Reduced Factors
|
|
Law enforcement |
Healthcare provider |
Health insurance company |
Device manufacturer |
Third party |
||||||||||
|
Variable |
B |
SE |
p |
B |
SE |
p |
B |
SE |
p |
B |
SE |
p |
B |
SE |
p |
|
Intercept |
3.39 |
0.27 |
2.0e-16 |
3.19 |
0.53 |
9.2e-9 |
2.96 |
0.38 |
3.0e-13 |
3.40 |
0.36 |
2e-16 |
2.88 |
0.29 |
2e-16 |
|
Privacy Autonomy |
|
|
|
0.12 |
0.06 |
0.043* |
0.16 |
0.06 |
0.006** |
0.11 |
0.06 |
0.04* |
0.12 |
0.05 |
0.008** |
|
Privacy Impact |
-0.38 |
0.06 |
7.4e-11** |
-0.22 |
0.06 |
0.000** |
-0.32 |
0.06 |
5.7e-7** |
-0.35 |
0.05 |
1.2e-8** |
-0.32 |
0.05 |
6.5e-10** |
|
Health Autonomy |
|
|
|
-0.14 |
0.06 |
0.03* |
|
|
|
|
|
|
|
|
|
|
Health Newness |
0.15 |
0.05 |
.002** |
|
|
|
0.14 |
0.05 |
0.012* |
0.11 |
0.06 |
0.02* |
|
|
|
|
Health Familiarity |
|
|
|
0.17 |
0.07 |
0.01* |
|
|
|
|
|
|
|
|
|
Note. This regression was completed using data from Scenario 3. *p<.05, **p<.01
Health_Newness also appeared to be significant for nearly all scenarios across all entities, except for Law enforcement in Scenario 2 (see Table 6b); and for Healthcare provider in Scenario 1 and 3 (see Table 6a and 6c). Recall that the Health_Newness factor in Health Risk Perception dimensions consists only of the Newness dimension of risk perception. For Law enforcement, Health_Autonomy also appeared to be significant in Scenario 1. The positive coefficients indicate that participants tend to be more comfortable share their data when they perceive a high level of autonomy on health risks.
For Scenario 3 when the data recipient is Healthcare provider, Health_Familiarity, Health_Autonomy, Privacy_Impact, and Privacy_Autonomy are all significant. Recall that Health_Familiarity in health risk perception consists of the understanding of the risks associated with exposure (i.e., Exposed) and how well scientific experts understand the risk (i.e., Science). This indicates that participants tend to be more comfortable sharing their Fitness Tracker data when the health risks are perceived better understood, by participants and by experts, and when participants perceive a high level of autonomy.
5. Do other factors influence participants’ privacy preferences?
Besides the research questions we discussed above, we explored if participants’ expertise had an impact on predicting their privacy preferences, given that their understanding of the privacy risks might vary by their level of expertise. As discussed in Section 3, in our survey we used the expertise measurement scale from Ravijan et al.’s (2017) work to evaluate participants’ expertise. Ravijan et al. has previously verified the calculation of two reduced factors: Computer Score (CS) corresponding to participants’ computer expertise and Security Score (SS) corresponding to participants’ security expertise. These two factors are positively correlated, with no party having a high CS with a low SS. We leveraged these two factors to test whether there was a relationship between participants’ expertise and privacy preferences.
5.1 Expertise vs. Privacy Preferences about data collection
We first tested the inter-correlation between the two factors for our populations. Our results suggest that these two factors are positively correlated but cannot be collapsed into one (r = .456). Then, we conducted linear regression analyses to derive the relationship with participants’ privacy preferences. We found neither CS nor SS to be statistically significant for predicting participants’ comfort with data collection with a Smartphone (Scenario 1) or a Security Camera (Scenario 2). Only CS is statistically significant in Scenario 3 (p = .039). The positive coefficient indicates that CS is positively correlated with participants’ comfort with data collection by Fitness Tracker. The consistently negative coefficients of SS might be due to participants with higher security expertise having a greater awareness of privacy risks and thus decreased comfort with data sharing. This possibility was supported by the correlation between SS and Privacy Familiarity, showing p = .0245 and B = .1643.
5.2 Expertise vs. Privacy Preferences about Data Sharing
We then conducted Multivariate Regression analyses for the 5 data recipients in each scenario. The results are shown in Tables 7a-c. We only found statistical significance for CS and SS for Health insurance company, Healthcare provider, and Third-party private companies. Specifically, both CS and SS are statistically significant for comfort with sharing with a Health insurance company in Scenario 1 and 3; and for Healthcare provider and Third-party private companies in Scenario 3 (see Tables 7a and 7c). Further, CS was also statistically significant for Health insurance company in Scenario 2 (see Table 7b). The consistent positive coefficients of CS indicate that participants’ computer expertise is positively correlated with their comfort with data sharing. Besides, the consistent negative coefficients of SS indicate that participants’ security expertise is consistently negatively correlated with their comfort with data sharing.
Table 7a. Multivariate Regression Analysis of Comfort with Smartphone Data Sharing Based on Expertise|
|
Law enforcement |
Healthcare provider |
Health insurance company |
Device manufacturer |
Third party |
||||||||||
|
Variable |
B |
SE |
p |
B |
SE |
p |
B |
SE |
p |
B |
SE |
p |
B |
SE |
p |
|
Intercept |
|
|
|
|
|
|
2.36 |
0.15 |
2e-16 |
|
|
|
|
|
|
|
Computer Expertise |
|
|
|
|
|
|
0.34 |
0.12 |
0.005** |
|
|
|
|
|
|
|
Security Expertise |
|
|
|
|
|
|
-0.19 |
0.08 |
0.022* |
|
|
|
|
|
|
Note. This regression was completed using data from Scenario 1. *p<.05, **p<.01
Table 7b. Multivariate Regression Analysis of Comfort with Fitness Tracker Data Sharing Based on Expertise
|
|
Law enforcement |
Healthcare provider |
Health insurance company |
Device manufacturer |
Third party |
||||||||||
|
Variable |
B |
SE |
p |
B |
SE |
p |
B |
SE |
p |
B |
SE |
p |
B |
SE |
p |
|
Intercept |
|
|
|
|
|
|
2.21 |
0.14 |
2e-16 |
|
|
|
|
|
|
|
Computer Expertise |
|
|
|
|
|
|
0.24 |
0.12 |
0.046* |
|
|
|
|
|
|
|
Security Expertise |
|
|
|
|
|
|
-0.12 |
0.08 |
0.15 |
|
|
|
|
|
|
Note. This regression was completed using data from Scenario 2. *p<.05, **p<.01
Table 7c. Multivariate Regression Analysis of Comfort with Security Camera Data Sharing Based on Expertise
|
|
Law enforcement |
Healthcare provider |
Health insurance company |
Device manufacturer |
Third party |
||||||||||
|
Variable |
B |
SE |
p |
B |
SE |
p |
B |
SE |
p |
B |
SE |
p |
B |
SE |
p |
|
Intercept |
|
|
|
3.23 |
0.14 |
2e-16 |
2.66 |
0.15 |
2e-16 |
|
|
|
2.01 |
0.12 |
2e-16 |
|
Computer Expertise |
|
|
|
0.32 |
0.12 |
0.008** |
0.31 |
0.12 |
0.012 |
|
|
|
0.21 |
0.10 |
0.04* |
|
Security Expertise |
|
|
|
-0.18 |
0.08 |
0.23 |
-0.23 |
0.08 |
0.004** |
|
|
|
-0.14 |
0.06 |
0.03* |
Note. This regression was completed using data from Scenario 3. *p<.05, **p<.01
Neither CS nor SS was statistically significant in Scenario 1 and 2 for Healthcare Provider and Third-party Private Companies. Also, neither of these two factors were found to be statistically significant for Law Enforcement and Device Manufacturer. Only CS was found to be statistically significant in Scenario 2 for Health Insurance Company, and this is the only significant factor in Scenario 2. CS is only significant in Scenario 2 for Health Insurance Company.
6. Discussion
Our results reveal a small and conditional significant difference between participants’ comfort with data sharing, and thus the potential impact of privacy preferences on data sharing, depending on the usage of data for public health during the current pandemic compared with the pre-pandemic purposes. Specifically, Figures 2-5 indicate that participants in the General Group (where we did not specifically mention data use for public health) in Scenario 3 tend to be more comfortable having their data compiled than participants’ in the Health Group.
Beyond that, we found a surprisingly small overall difference. Our findings also revealed some interesting patterns. Specifically, as noted in Section 4.1, we found that people’s privacy perceptions and risk perception did not differ when the use was for health, despite the on-going health crisis. This finding contradicts previous research which indicated people are less concerned about their privacy when there is a public health crisis (Altmann, et al., 2020; University of Maryland, 2020).
Second, the analysis in Section 4.2.2.1 revealed that Privacy_Autonomy and Privacy_Impact are the two most significant factors in predicting participants’ comfort with data collection in all three scenarios. Thus, participants’ comfort with data compilation and disclosure increases with their perceived level of control. This aligns with previous studies (Brandimarte et al., 2013). Participants’ comfort with data use decreases with their perceived severity of consequences. This aligns with the importance of severity of risks in previous work on both health and computing risks.
In general, participants’ health risk perceptions seemed to have no impact in predicting their privacy preferences about data collection, except in Scenario 1, where Health_Newness appeared to be statistically significant. This might imply that participants are less willing to cooperate with data collection through Smartphones over time. We also reported that Health_Newness positively correlated with participants’ comfort of data collection via Smartphones and comfort of data sharing with all five entities. The consistent positive coefficients of Health_Newness indicate that participants tend to be more comfortable sharing their data when they face a relevantly new health risk. This might be explained by the Construal level theory, which suggests that newer risks are perceived with larger temporal distance and result in abstract perceptions (Trope and Liberman, 2010). Thus, novel risks are perceived to be less well-known with more uncertainty (Garg and Camp, 2012). Furthermore, this may raise the fear of uncontrollability and unpredictability of what could happen in the future and invoke people’s actions of seeking protection (Johnston and Warkentin, 2010). In our case, such protection-seeking action is represented by the higher comfort with data sharing. Similarly, this reifies a protection motivation theory (Herath and Rao, 2009) and previous work in risk perception.
Third, as reported in Section 4.2.2.2, we found that Privacy_Autonomy is statistically significant in nearly all scenarios for all entities, except for Law enforcement in Scenario 1 and 3, and Healthcare provider in Scenario 2. The absence of Privacy_Autonomy in Law enforcement may reflect the fact that the provision of personal information to government entities is compulsory when it is for the purpose of law enforcement. This is supported by the nature of governmental mandates, which potentially leads to the loss of control even when participants’ are unwilling to share (see Figures 3-5 Median(Law enforcement) ≈ 2.0). In comparison, people have more flexibility in choosing their own Healthcare provider. Thus, the absence of Privacy_Autonomy for Healthcare provider may implies they have some level of trust (i.e., less concern about controllability) (see Figures 3-5, Median(Healthcare provider) ≥ 3.0) but still are concerned about their Smartphone and Fitness Tracker data which might contain more details of their daily activities. Alternatively, those who identify that the American health insurance and care structures remove autonomy would argue that compulsive is the explanation for both cases.
In general, we saw nearly no significant results for participants’ health risk perceptions having an impact in predicting participants’ privacy preferences. This is reflected in the reduced factors from health risk perception being sparse in Tables 5a-c and Tables 6a-c. Participants’ comfort was mainly correlated with their privacy risk perceptions. This might explain why participants’ aggregate privacy preferences remained similar with or without the data being used for public health, although the perceptual components of that concern differed.
Finally, in examining computer expertise (in Section 5.2) we found that the two expertise factors (i.e., CC and CS) are not statistically significant in predicting participants’ privacy preference for data sharing with Law Enforcement or Device Manufacturer. This, again, may reflect that such data sharing is often mandatory (please recall the Autonomy results.) Specifically, data sharing with governmental entities is often mandated by Law Enforcement. Further, using a device implies potentially unavoidable data sharing with the manufacturing company. In addition, CS was only found to be significant in Scenario 2 for Health Insurance Company. This might be due to greater public concern about Security Camera data and less comfort with sharing or compilation (see Figures 2-5). Beyond that, participants’ expertise had no impact in predicting their privacy preference in Scenario 1 and 2 for Third-party private companies. This result suggests that the trust issues with technology providers deserve further exploration, as much of the focus on data sharing addresses third parties.
We can offer explanations from previous research, but no certainty as to why CS has uniformly positive coefficients and the SS has uniformly negative coefficients. Participants’ security expertise was correlated with decreased comfort with all data sharing. Note that Computing Expertise is a requirement for Security Expertise, so the SS can arguably be considered the risk-aware subset of CS. In general, this means participants with a higher level of computer expertise tend to be more comfortable sharing their data with Health Insurance Company, Healthcare Provider, and Third-party Private Companies. However, such comfort is limited and varies by device type.
Finally, in expertise, we found no significance for health expertise as defined by correctly answering questions about COVID-19. This was true in a simple correlation, multivariate analysis, and PCA.
7. Conclusion and Future Work
Our analysis of risk perceptions suggests that participants’ privacy preference is primarily driven by their perceived control and the perceived severity of consequences. It is reasonable to test if participants’ perceptions of control over non-health dimensions of data-sharing changes after the pandemic. Our current plan is to reproduce the survey post-pandemic then develop a hierarchical analysis of both datasets. Second, participants’ health risk perceptions seemed to have no influence on their privacy preferences, even in the Health Group where we explicitly mentioned a public health crisis. However, the public crisis may be so ubiquitous in its impact that all answers may, upon post-hoc repetition and analysis, be answers about public health. We found that perceived “Newness” of health risks is statistically significant in nearly all scenarios across all entities. This aligns with the protection motivation theory. Thus, an evaluation of risk perception when COVID-19 is no longer new or news may be illustrative. In addition, we also found that participants’ who have higher computer expertise perceive higher levels of autonomy and lower levels of impact, which correlated to higher comfort level; and conversely security expertise corresponds to decreased comfort. This reflects the critical difference between correlation and causation, as computer security expertise results in increased knowledge of risk and computer security expertise also indicate an exogenous interest or concern about computing risks. We plan to further explore the combination of recipients and devices for the same data type, based on the findings illustrated in Section 4.1.
Acknowledgment
This research was supported in part by the National Science Foundation awards CNS 1565375 and CNS 1814518, the National Security Agency #H8230-19-1-0310, Cisco Research Support, Google Research, the Comcast Innovation Fund, and the Indiana University Ostrom Workshop Fellowship. Any opinions, findings, and conclusions or recommendations expressed in this material are those of the author(s) and do not necessarily reflect the views of the US Government, the National Science Foundation, the National Security Agency, Cisco, Comcast, Google, Indiana University, nor the Ostrom Workshop. We would like to acknowledge Sameer Patil for assistance with survey design, and Jayati Dev for collaborating on data analysis.
8. References
ACM Europe Technology Policy Committee. (2020). LEADING EUROPEAN COMPUTING SOCIETY CALLS FOR TRANSPARENCY, INTEROPERABILITY, PRIVACY, AND SCRUTINY IN COVID CONTACT TRACING. Retrieved from https://www.acm.org/binaries/content/assets/press-releases/2020/may/acm-europe-tpc-statement-on-contact-tracing.pdf
ACM Europe Technology Policy Committee. (2020). STATEMENT ON ESSENTIAL PRINCIPLES AND PRACTICES FOR COVID-19 CONTACT TRACING APPLICATIONS. Retrieved from https://www.acm.org/binaries/content/assets/public-policy/europe-tpc-contact-tracing-statement.pdf
Altmann, S., Milsom, L., Zillessen, H., Blasone, R., Gerdon, F., Bach, R., . . . Abeler, J. (2020). Acceptability of app-based contact tracing for COVID-19: Cross-country survey evidence. medRxiv.
Andrea Spikes. (2011, May 16). Smart Meters and a Smarter Grid. Retrieved from Department of Energy: https://www.energy.gov/energysaver/articles/smart-meters-and-smarter-grid
Annas, G.J (2002). Bioterrorism, Public Health, and Civil Liberties. New England Journal of Medicine, 346(17), 1337-1342. https://doi.org/10.1056/NEJM200204253461722
Australian Government Department of Health. (2020). COVIDSafe app. Retrieved from https://www.health.gov.au/resources/apps-and-tools/covidsafe-app
Bauer, R. A. (1960). Consumer behavior as risk taking. In M. J. Baker, Marketing: Critical Perspectives on Business and Management (Vol. 3, pp. 384-398). Chicago: Routledge.
Bhasin, M. L. (2006). Guarding privacy on the Internet. Global Business Review, 137-156.
Blank, G., Dutton, W. H., & Lefkowitz, J. (2019). Perceived Threats to Privacy Online: The Internet in Britain, the Oxford Internet Survey. the Oxford Internet Survey.
Blendon, R. J., Benson, J. M., DesRoches, C. M., Raleigh, E., & Taylor-Clark, K. (2004). The public's response to severe acute respiratory syndrome in Toronto and the United States. Clinical infectious diseases, 38(7), 925-931.
Brace, I. (2008). Questionnaire Design: How to Plan, Structure and Write Survey Material for Effective Market Research. Kogan Page. Retrieved from https://books.google.com/books?id=0r8xOI5rBZoC
Brandimarte, L., Acquisti, A., & Loewenstein, G. (2013). Misplaced Confidences: Privacy and the Control Paradox. Social Psychological and Personality Science, 4(3), 340-347.
Brush, A. B., Krumm, J., & Scott, J. (2010). Exploring end user preferences for location obfuscation, location-based services, and the value of location. 12th ACM International Conference on Ubiquitous Computing (pp. 95-104). Association for Computing Machinery.
Castañeda, J. A., & Montoro, F. J. (2007). The effect of Internet general privacy concern on customer behavior. Electronic Commerce Research, 7(2), 117-141.
Castro, D., & McLaughlin, M. (2019). Survey: Majority of Americans Willing to Share Their Most Sensitive Personal Data. Retrieved from https://www.datainnovation.org/2019/01/survey-majority-of-americans-willing-to-share-their-most-sensitive-personal-data/
Centers for Disease Control and Prevention. (2019). Healthy Habits to Help Prevent Flu. Retrieved from https://www.cdc.gov/flu/prevent/actions-prevent-flu.htm
Centers for Disease Control and Prevention. (2019). How to Prevent the Spread of Respiratory Illnesses in Disaster Evacuation Centers. Retrieved from https://www.cdc.gov/disasters/disease/respiratoryic.html
Centers for Disease Control and Prevention. (2019). How to Protect Yourself and Others. Retrieved from https://www.cdc.gov/coronavirus/2019-ncov/prevent-getting-sick/prevention.html
Centers for Disease Control and Prevention. (2020). Contact Tracing: Contact tracing is key to slowing the spread of COVID-19 and helps protect you, your family, and your community. Retrieved from CDC 24/7: Saving Lives, Protecting People: https://www.cdc.gov/coronavirus/2019-ncov/daily-life-coping/contact-tracing.html
Christiane, A., & Peter M., S. (2010). Experimental Vignette Studies in Survey Research. Methodology, 128-138. Retrieved from https://doi.org/10.1027/1614-2241/a000014
Cvrcek, D., Kumpost, M., Matyas, V., & Danezis, G. (2006). A study on the value of location privacy. 5th ACM Workshop on Privacy in Electronic Society (pp. 109-118). Association for Computing Machinery.
Department of Justice. (n.d.). 1122. INTRODUCTION TO THE ECONOMIC ESPIONAGE ACT. Retrieved from justice.gov: https://www.justice.gov/jm/criminal-resource-manual-1122-introduction-economic-espionage-act
Department of Justice. (2015, July 17). Privacy Act of 1974. Retrieved from Department of Justice: https://www.justice.gov/opcl/privacy-act-1974
Department of Justice. (2019, February 13). E-Government Act of 2002. Retrieved from Department of Justice: https://www.justice.gov/opcl/e-government-act-2002
Department of Justice. (2019, April 23). Electronic Communications Privacy Act of 1986 (ECPA). Retrieved from Justice Information Sharing: https://it.ojp.gov/PrivacyLiberty/authorities/statutes/1285
Department of Motor Vehicles. (1994). Driver's Privacy Protection Act. US. Retrieved from https://dmv.ny.gov/forms/mv15dppa.pdf
Dolnicar, S., & Jordaan, Y. (2006). Protecting consumer privacy in the company's best interest. Australasian Marketing Journal, 14(1), 39-61.
Egelman, S., Tsai, J., Cranor, L. F., & Acquisti, A. (2009). Timing is everything?: the effects of timing and placement of online privacy indicators. the SIGCHI Conference on Human Factors in Computing Systems (pp. 319–328). Association for Computing Machinery.
European Commission. (2020). Coronavirus: a common approach for safe and efficient mobile tracing apps across the EU*. Retrieved from https://ec.europa.eu/commission/presscorner/detail/en/qanda_20_869
Evans, J. R., & Mathur, A. (2005). The value of online surveys. Internet research, 195-219. Retrieved from https://doi.org/10.1108/10662240510590360
FDIC.gov. (2006, June). Right to Financial Privacy Act. FDIC Consumer Compliance Examination Manual, 3.1-3.2. Retrieved from https://www.fdic.gov/regulations/compliance/manual/8/viii-3.1.pdf
Federal Bureau of Investigation. Amerithrax or Anthrax Investigation. https://www.fbi.gov/history/famous-cases/amerithrax-or-anthrax-investigation
Federal Trade Comission. (2000, May 24). Privacy of Consumer Financial Inforamtion; Final Rule. Federal Register, 65(101), 33645-33689. Retrieved from https://www.ftc.gov/sites/default/files/documents/federal_register_notices/privacy-consumer-financial-information-16-cfr-part-313/000524privacyofconsumer.pdf
Federal Trade Commission. (2013). Children's Online Privacy Protection Act of 1998. Retrieved from Federal Trade Commission: https://www.ftc.gov/enforcement/rules/rulemaking-regulatory-reform-proceedings/childrens-online-privacy-protection-rule
Federal Trade Commission. (2018, September). Fair Credit Reporting Act. Retrieved from ftc.gov: https://templates.legal/fair-credit-reporting-act/
Ferretti, L., Wymant, C., Kendall, M., Zhao, L., Nurtay, A., Abeler-Dörner, L., Parker, M., Bonsall, D., & Fraser, C. (2020). Quantifying SARS-CoV-2 transmission suggests epidemic control with digital contact tracing. Science, 368(6491).
Finch, J. (1987). The Vignette Technique in Survey Research. Sociology, 21(1), 105-114. Retrieved from https://doi.org/10.1177/0038038587021001008
Fincham, J. E. (2008). Response rates and responsiveness for surveys, standards, and the Journal. American journal of pharmaceutical education, 72(2), 43.
Fischhoff, B., Slovic, P., Lichtenstein, S., Read, S. J., & Combs, B. (1978). How safe is safe enough? A psychometric study of attitudes towards technological risks and benefits. Policy Sciences, 9(2), 127-152.
Garg, V., & Camp, L. (2012). End User Perception of Online Risk under Uncertainty. Annual Hawaii International Conference on System Sciences, 3278-3287.
Gopavaram, S., Momenzadeh, B., & Camp, L. J. (2020). Can You Hear Me Now?: Audio and Visual Interactions that Change App Choices. under revision for Frontiers in Psychology, 2227.
Grossklags, J., & Acquisti, A. (2007). When 25 Cents is Too Much: An Experiment on Willingness-To-Sell and Willingness-To-Protect Personal Information. 6th Annual Workshop on the Economics of Information Security (WEIS).
Grunert, K. G. (2005). Food quality and safety: consumer perception and demand. European Review of Agricultural Economics, 32(3), 369-391.
Hardin, G. (1968, December 13). The Tragedy of the Commons. Science, 162(2859), 1243-1248. doi:10.1126/science.162.3859.1243
Hauser, D. J., & Schwarz, N. (2016). Attentive Turkers: MTurk participants perform better on online attention checks than do subject pool participants. Behavior research methods, 48(1), 400-407.
Herath, T., & Rao, H. R. (2009). Protection motivation and deterrence: A framework for security policy compliance in organisations. European Journal of Information Systems, 18(2), 106-125.
HHS. (2013, July 26). Summary of the HIPAA Privacy Rule. Retrieved from HHS.gov: https://www.hhs.gov/hipaa/for-professionals/privacy/laws-regulations/index.html
Huebner, M., Vach, W., & le Cessie, S. (2016). A systematic approach to initial data analysis is good research practice. The Journal of Thoracic and Cardiovascular Surgery, 25-27.
Johnston, A. C., & Warkentin, M. (2010). Fear Appeals and Information Security Behaviors: An Empirical Study. MIS Quarterly, 549-566.
Kaye, K. (2019, June 19). Portland lawmakers pass privacy resolution to guide policies for facial recognition, other data use. Retrieved from GeekWire: https://www.geekwire.com/2019/facial-recognition-video-surveillance-highlight-new-privacy-resolution-passed-portland-lawmakers/
Kline, P. (2014). An Easy Guide to Factor Analysis. Taylor & Francis.
Lau, J. T., Yang, X., Tsui, H., & Kim, J. H. (2003). Monitoring community responses to the SARS epidemic in Hong Kong: from day 10 to day 62. Journal of Epidemiology & Community Health, 57(11), 864-870.
Liu, C. M., Lu, J., & Yu, C.-S. (2005). Beyond concern—a privacy-trust-behavioral intention model of electronic commerce. Information & Management, 42(2), 289-304.
M.Smith, S., A.Roster, C., L.Golden, L., & S.Albaumb, G. (2016). A multi-group analysis of online survey respondent data quality: Comparing a regular USA consumer panel to MTurk samples. Journal of Business Research, 69(8), 3139-3148.
Malhotra, N. K., Kim, S. S., & Agarwal, J. (2004). Internet users' information privacy concerns (IUIPC): The construct, the scale, and a causal model. Information systems research, 15(4), 336-355.
McKnight, P. E., & Najab, J. (2010). Mann-Whitney U Test. In The Corsini Encyclopedia of Psychology (pp. 1-1). Wiley Online Library.
Naeini, P. E., Bhagavatula, S., Habib, H., Degeling, M., Bauer, L., Cranor, L. F., & Sadeh, N. (2017). Privacy Expectations and Preferences in an IoT World. the Thirteenth USENIX Conference on Usable Privacy and Security (pp. 399-412). USENIX Association. Retrieved from https://dl.acm.org/doi/10.5555/3235924.3235956
Norberg, P. A., Horne, D. R., & Horne, D. A. (2007). The privacy paradox: Personal information disclosure intentions versus behaviors. Journal of consumer affairs, 41(1), 100-126.
Nordgren, L. F., Van Der Pligt, J., & Van Harreveld, F. (2007). Unpacking perceived control in risk perception: The mediating role of anticipated regret. Journal of Behavioral Decision Making, 20(5), 533-544.
Office of The Assistant Securetary for Planning and Evaluation. (1996). Health Insurance Portability and Accountability Act of 1996. Retrieved from Office of The Assistant Securetary for Planning and Evaluation: https://aspe.hhs.gov/report/health-insurance-portability-and-accountability-act-1996
Oulasvirta, A., Pihlajamaa, A., Perkiö, J., Ray, D., Vähäkangas, T., Hasu, T., . . . Myllymäki, P. (2012). Long-term effects of ubiquitous surveillance in the home. 2012 ACM Conference on Ubiquitous Computing (pp. 41-50). Association for Computing Machinery.
Patil, S., Norcie, G., Kapadia, A., & Lee, A. J. (2012). Reasons, rewards, regrets: privacy considerations in location sharing as an interactive practice. Eighth Symposium on Usable Privacy and Security (pp. 1-15). Association for Computing Machinery.
Prosser, W. L. (1960). Privacy. California Law Reivew, 48(3), 383-423. doi:10.15779/Z383J3C
Rainie, L., & Duggan, M. (2016). Privacy and Information Sharing. Pew Research Center. Retrieved from https://www.pewresearch.org/internet/2016/01/14/privacy-and-information-sharing/
Rajivan, P., Moriano, P., Kelley, T., & Camp, L. J. (2017). Factors in an end user security expertise instrument. Information and Computer Security, 190-205.
Ross, C. (2020, April 8). After 9/11, we gave up our privacy for security. Will we make the same tradeoff for after COVID-19? STAT News. https://www.statnews.com/2020/04/08/coronavirus-will-we-give-up-privacy-for-security/
Sjöberg, L. (2000). Factors in risk perception. Risk analysis, 1-12.
Solove, D. J. (2011). Nothing to hide: The false tradeoff between privacy and security. Yale University Press.
Slovic, P. E. (2000). The perception of risk. Science, 280-285.
Slovic, P., Fischhoff, B., & Lichtenstein, S. (1980). Facts and fears: Understanding perceived risk. Societal risk assessment, 181-216.
Snook, S. C., & Gorsuch, R. L. (1989). Component analysis versus common factor analysis: A Monte Carlo study. Psychological Bulletin, 19(1), 148–154.
Starr, C. (1969). Social benefit versus technological risk. Science, 1232-1238.
Statistics How To. (2016). Holm-Bonferroni Method: Step by Step. Retrieved from https://www.statisticshowto.com/holm-bonferroni-method/
Taylor, H. (2003). Most People Are "Privacy Pragmatists" Who, While Concerned about Privacy, Will Sometimes Trade It Off for Other Benefits. The Harris Poll, 17(19), 44.
Teltzrow, M., Meyer, B., & Lenz, H.-J. (2007). Multi-channel consumer perceptions. Journal of Electronic Commerce Research, 8(1), 18-31.
Trope, Y., & Liberman, N. (2010). Construal-level theory of psychological distance. Psychological review, 117(2), 440.
University of Maryland. (2020). Washington Post-University of Maryland national poll, April 21-26, 2020. WashingtonPost. Retrieved from https://www.washingtonpost.com/context/washington-post-university-of-maryland-national-poll-april-21-26-2020/3583b4e9-66be-4ed6-a457-f6630a550ddf/?itid=lk_inline_manual_3
Waddell, K. (2019, June 29). Cities are writing privacy policies. Retrieved from AXIOS.com: https://www.axios.com/cities-data-privacy-laws-fa0be8cb-234f-4237-b670-10ad042a772e.html
Weinstein, N. D. (1984). Why it won't happen to me: perceptions of risk factors and susceptibility. Health psychology, 3(5), 431.
Weinstein, N. D. (1988). The Precaution Adoption Process. Health psychology3, 7(4), 355.
Zetter, K. (2014, November 28). Hacker Lexicon: What Is the Computer Fraud and Abuse Act? Retrieved from WIRED.com: https://www.wired.com/2014/11/hacker-lexicon-computer-fraud-abuse-act/
Zhang, B., Kreps, S. E., & McMurry, N. (2020). Americans' perceptions of privacy and surveillance in the COVID-19 Pandemic. OSF Preprints.
[1] For more information about how a representative sample is selected in Prolific, see https://researcher-help.prolific.co/hc/en-gb/articles/360019236753-Representative-Samples-on-Prolific
Appendix A
Survey Questionnaire
I. General Questions
Q1. What is your Prolific ID?
Q2. We care about the quality of our data. In order for us to get the most accurate measures of your knowledge and opinions, it is important that you thoughtfully provide your best answers to each question in this study. Will you provide your best answer to each question in this study?
(a) Yes; I will provide my best answers.
(b) No; I will not provide my best answers.
(c) I cannot promise either way.
Q3. Which of the following things do you use in your daily life? (select all that apply.)
(a) Smartphone
(b) Fitness Tracker (e.g., Fitbit, smartwatch)
(c) Security Camera
(d) none of above
II. Scenario 1
Consider the following scenario:
[General Group Scenario 1] or [Health Group Scenario 1]
For this scenario, answer the following questions.
Q4. Please rate your level of agreement with each of the following statements [1 = Strongly disagree, 5 = Strongly agree]:
(a) The use of my data in this scenario would be beneficial to me
(b) The use of my data in this scenario would be beneficial to other people.
(c) It’s important that you pay attention to this study. Please select ’Strongly dis- agree.’
Q5. In your opinion, should other people allow or deny the collection and sharing of the data described in the scenario?
(a) Allow
(b) Deny
(c) I am not sure
Q6. Please rate your level of comfort with the data collection in this scenario: [1 = Extremely uncomfortable, 5 = extremely comfortable]
Q7. How do you feel about sharing the data collected in this scenario with each of the following entities? (assume that you would not be told how the entities would use your data). [1 = Extremely uncomfortable, 5 = extremely comfortable]
(a) Law enforcement
(b) Healthcare provider
(c) Health insurance company
(d) Device Manufacturer
(e) Third-party private companies
Q8. Who do you think should be responsible for storing and maintaining the data collected in this scenario? (Select all that apply.)
(a) Law enforcement
(b) Healthcare provider
(c) Health insurance company
(d) Device Manufacturer
(e) Third-party private companies
Q9. How long do you think the data collected in this scenario should be stored?
(a) For a fixed time (e.g., 14 days, 1 month)
(b) Until the data is no longer needed
(c) Until you ask to delete the data
(d) Other, please specify:
Q10. Would such scenarios occur in real life?
(a) They already happen today
(b) They are likely to happen in the near future (within the next 2 years).
(c) They are likely to happen at some point in the future (after 2 years)
(d) They are unlikely to happen
(e) I am not sure
III. Scenario 2
Consider the following scenario:
[General Group Scenario 2] or [Health Group Scenario 2]
For this scenario, answer the following questions: [repeat the questions in Scenario 1]
IV. Scenario 3
Consider the following scenario:
[General Group Scenario 3] or [Health Group Scenario 3]
For this scenario, answer the following questions: [repeat the questions in Scenario 1]
V. Perception of Privacy Risk
Now that you have responded to questions about the three scenarios, we would like to ask you about the risks of privacy loss due to the collection and sharing of your location data, as described in the previous scenarios.
Q11. Voluntary: Is your exposure to the risks of privacy loss in your control (voluntary risk), or out of your control (involuntary risk)?: [1 = voluntary; 5 = involuntary]
Q12. Immediacy: Is the impact of exposing your private information immediate, or does it happen at a later point in time (delayed risk)?: [1 = immediate; 5 = delayed]
Q13. Knowledge to exposed: To what extent do you understand the consequences of privacy loss?: [1 = understand completely; 5 = don’t understand at all]
Q14. Knowledge to science: To what extent do you think experts understand the conseuqnces of privacy loss?: [1 = understand completely; 5 = don’t understand at all]
Q15. Controllability: To what extent do you have control over the consequences of privacy loss?: [1 = complete control; 5 = no control]
Q16. Newness: Are these risks new, novel ones, or old, familiar ones?: [1 = new; 5 = old]
Q17. Chronic-catastrophic: Is this a risk that effects people one at a time (chronic risk), or a large number of people at once (catastrophic risk)?: [1 = chronic; 5 = catastrophic]
Q18. Common-Dread: Is this a risk that you have learned to live with and can think about reasonable calmly (common risk), or is it one that you dread on the level of a gut reaction (dreadful risk)?: [1 = common; 5 = dreadful]
Q19. Severity of Consequences: In your opinion, how severe are the consequences of privacy loss?: [1 = not severe; 5 = severe]
VI. Expertise Questions
Please tell us a bit about your experience with technology
Q20. Have you ever done any of the following? (Select all that apply.)
(a) Written a computer program
(b) Configured a firewall
(c) Designed a website
(d) Registered a domain name
(e) Used SSH
(f) Created a database
(g) Installed a computer program
(h) None of the above
Q21. Which of the following statements apply to you? (Select all that apply.)
(a) I have attended a computer security conference in the past year.
(b) I have a degree in an IT-related field (e.g.information technology, computer science, electrical engineering).
(c) Computer security is one of my primary job responsibilities.
(d) I have taken or taught a course on computer security.
(e) None of the above
VII. Perceptions of Health Risk
Now, we would like to ask you questions about health risks. Consider the risks from infectious diseases, and please answer the following questions for those risks.
Q22. Voluntary: Is your exposure to the risks of infectious diseases in your control (voluntary risk), or out of your control (involuntary risk)?: [1 = voluntary; 5 = involuntary]
Q23. Immediacy: Is the impact of being exposed to an infectious disease immediate, or does it happen at a later point in time (delayed risk)?: [1 = immediate; 5 = delayed]
Q24. Knowledge to exposed: To what extent do you understand the consequences of infectious diseases?: [1 = understand completely; 5 = don’t understand at all]
Q25. Knowledge to science: To what extent do you think experts understand the consequences of infectious diseases?: [1 = understand completely; 5 = don’t understand at all]
Q26. Controllability: To what extent do you have control over the consequences of infectious diseases?: [1 = complete control; 5 = no control]
Q27. Newness: Are these risks new, novel ones, or old, familiar ones?: [1 = new; 5 = old]
Q28. Chronic-catastrophic: Is this a risk that effects people one at a time (chronic risk), or a large number of people at once (catastrophic risk)?: [1 = chronic; 5 = catastrophic]
Q29. Common-Dread: Is this a risk that you have learned to live with and can think about reasonable calmly (common risk), or is it one that you dread on the level of a gut reaction (dreadful risk)?: [1 = common; 5 = dreadful]
Q30. Severity of Consequences: In your opinion, how severe are the consequences of infectious diseases?: [1 = not severe; 5 = severe]
VIII. Infectious Disease Questions
Q31. How concerned are you about getting an infectious disease? [1 = Not at all concerned, 5 = Extremely concerned]
Q32. How do infectious diseases (e.g., flu) spread? (Select all that apply.)
(a) Only by people who show symptoms
(b) From person to person
(c) Through touching frequently used surfaces such as doorknobs, shopping carts, phones, and faucets
(d) When an infected person coughs, sneezes, or talks
(e) I don’t know
Q33. Which of the following habits help reduce your risk of exposure to an infectious disease?
(Select all that apply.)
(a) Washing your hands with soap and water for at least 20 seconds
(b) Avoiding close contact with people who are sick
(c) Covering your mouth and nose with a cloth mask when around others
(d) Covering your coughs and sneezes with your elbow
(e) Cleaning and disinfecting frequently touched surfaces
(f) Putting distance between yourself and other people when out in public
(g) Avoiding touching your eyes, nose, and mouth with unwashed hands
(h) I don’t know
Q34. Which of the following habits help reduce the risk of exposing others to an infectious disease? (Select all that apply.)
(a) Washing your hands with soap and water for at least 20 seconds
(b) Avoiding close contact with people who are sick
(c) Covering your mouth and nose with a cloth mask when around others
(d) Covering your coughs and sneezes with your elbow
(e) Cleaning and disinfecting frequently touched surfaces
(f) Putting distance between yourself and other people when out in public
(g) Avoiding touching your eyes, nose, and mouth with unwashed hands
(h) I don’t know
IX. COVID-19 Questions
Now that you have answered questions about infectious diseases in general, we would like to ask you questions related to COVID-19, the disease caused by the novel coronavirus.
Q35. How likely is another pandemic similar to COVID-19 in the next 10 years? [1 = Extremely unlikely, 5 = extremely likely]
Q36. Several states have imposed stay-at-home restrictions, asking people to stay home except for essential tasks. (NOTE: Stay-at-home restriction is also referred to as safer- at-home or shelter-in-place.) Please rate your level of agreement with the following statements regarding such restrictions: [1 = strongly disagree, 5 = strongly agree]
(a) I feel socially isolated due to the stay-at-home restrictions
(b) I felt socially isolated before the stay-at-home restrictions.
Q37. Please rate your level of agreement with the following statements: [1 = strongly dis- agree, 5 = strongly agree]
(a) Stay-at-home restrictions are beneficial to me.
(b) Stay-at-home restriction are beneficial to society.
Q38. Please answer the following questions: [1 = not at all strictly, 5 = extremely strictly]
(a) How strictly are the people in your neighborhood following the stay-at-home re- strictions?
(b) How strictly are you following the stay-at-home restrictions?
Q39. What has made following the stay-at-home restrictions difficult? (Select all that apply.)
(a) I do not have a safe place to stay at home
(b) Stay-at-home restrictions are unnecessary
(c) I have care-giving responsibilities
(d) My work is classified as essential
(e) Other, please specify:
(f) There are no stay-at-home restrictions in my state.
Q40. When did you begin following the stay-at-home restrictions?
(a) Before my state imposed stay-at-home restrictions.
(b) When my state imposed stay-at-home restrictions.
(c) Sometime after my state imposed stay-at-home restrictions
(d) There are no stay-at-home restrictions in my state, but I began following the restriction days ago. (Please enter an approximate number.)
Q41. Do you know anyone who has tested positive for COVID-19?
(a) Yes
(b) No
(c) Prefer not to answer
Q42. How has COVID-19 changed your life (e.g., daily routines, behaviors, and your food preferences)?
X. Demographic questions
Finally, please tell us a bit about yourself.
Q43. Which is your gender?
(a) Male
(b) Female
(c) Non-binary
(d) Prefer to self-describe:
(e) Prefer not to disclose
Q44. How many people live in your household (including you)?
(a) Kids (under 18):
(b) Adults (18-65 years):
(c) Seniors (above 65 years):
Q45. What is the highest level of formal education you have completed?
(a) Less than a high school diploma
(b) High school degree or equivalent
(c) Associate’s degree (e.g., AA, AS)
(d) Bachelor’s degree (e.g., BA, BS)
(e) Graduate or professional degree (e.g., MA, MD, PhD) (f) Other, please specify:
(g) Prefer not to answer
Q46. What is your employment status?
(a) Full-time employed
(b) Part-time employed
(c) Not in the labor force (e.g., retired, homemaker)
(d) Unemployed looking for work
(e) Student
(f) Other, please specify:
(g) Prefer not to answer Q47. What is your occupation?
Q48. Approximately, how much was your household income before taxes in 2019? Q49. What is your racial and ethnic background? (Select all that apply.)
XI. Closing Questions
Q50. Is there anything else you would like to tell us? Please feel free to include any questions, concerns, or suggestions.
Q51. Did you encounter any technical difficulties during this study?
(a) No
(b) Yes, please specify:
Q52. Enter your Prolific email address if you would you like to receive aggregate results of this survey.
