1. Introduction
The research presented here will attempt to offer insight into the use of semantic networks based on keywords as a tool for the analysis of academic writing. First direction of investigation is the analysis of the development of the topics and subjects addressed in the proceedings of the Crisis Management Days conferences. This international scientific and professional conference organised by the University of Applied Sciences Velika Gorica deals with various aspects of crisis management. The conference is a yearly event that was first held in 2007. It covers several re-occurring topics such as crisis management, communication, related legislation, national security, risk management, critical infrastructure, public health, business continuity, information security, climate and ecology. The languages of the conference are both English and Croatian, and most of the conference papers are written in Croatian. However, almost all papers have an English version of the abstract and keywords. The second direction of investigation is to test the proposed natural language processing methodology used to semantically analyse and present the extracted keywords in a semantic network.
The next chapter will provide a brief overview of related research and theoretical background of the selected approach and methodology. Third chapter will introduce the data source and its preparation while the fourth will list the methodology and steps taken to analyse and process the dataset. Fifth chapter will provide an overview of the results; keyword frequencies and semantic network graphs, accompanied by a discussion. Final chapter will try to offer a conclusion of the presented work and future lines of research.
2. Related work
Semantic networks are an important tool in knowledge representation and are used for modelling sematic relationships and presenting them in the form of graphs (Sowa, 1991). Developments in machine learning and natural language processing techniques have enabled researchers to build semantic networks on large scale textual data. Recent developments in artificial intelligence, namely the development of large language models, are in part connected to semantic networks and their interplay is currently an area of great interest (Tang et al., 2023).
The primary method used in this paper is based on word representation using vectors. This is an established method for determining semantic similarity or distances between words, and building upon that, larger text entities such as documents (Manning & Schütze, 1999, p. 294). The limitations of this method are being overcome by larger training models and increase in computing power.
In the field of bibliometrics, a combination of qualitative and quantitative content analysis using research papers’ keywords and their semantic relationships has been detected as a tool with great potential in monitoring particular research areas by several authors (Weismayer & Pezenka, 2017a) (González et al., 2018). They argue that a keyword analysis approach, rather than a full-text approach, simplifies the process as the keywords describe (or should describe) the content of the article. Other researchers combine keyword analysis with bibliometric methodology in order to determine which keywords correspond to high or low citation numbers and development of new research areas (Pesta et al., 2018). Keywords are being used as the basis for constructing knowledge structures or networks (Su & Lee, 2010) while some researchers are designing automated taxonomy construction procedures in combination with machine learning algorithms (Song et al., 2015) based on them.
3. Keyword extraction and dataset preparation
The keywords were extracted from 13 available proceedings of the Crisis Management Days conference. The first available proceedings were published in 2011 and the last in 2023, as open access documents available online[1]. The conference proceedings were originally PDF files which were converted to plain text. The keywords were extracted to a separate file which contained the year of the conference and the keyword set. In total, 730 sets of keywords were extracted, containing 3025 individual keywords. Further analysis returned 1873 distinct keywords whose occurrence was counted to create a frequency list.
Next step was the detection of similarity between distinct keyword sets. This was done by iterating through the 730 sets and comparing them with all other sets. The algorithm used the Gensim set of libraries (Řehůřek & Sojka, 2010), firstly for preprocessing and then for calculating distance semantic between two keyword sets. Gensim is a freely available Python library used for creating vector representations of text documents based on unsupervised machine learning algorithms which can then be used for the creation of semantic network graphs (Řehůřek, 2022). The application of the Gensim library and its method is aimed at text documents. However, this research intended to test its functionality with very specific and short text forms: author created keywords associated with scientific and professional papers published in the proceedings of a conference. Since the task is rather specific and the word pool found in keywords limited, it was decided to use a pretrained model (keyed vector) created by Gensim. The model used is the glove-wiki-gigaword-100 which is trained on 6 billion tokens collected from Wikipedia and consists of 400,000 word vectors. The vectors represent semantic distances between the words it contains. These distances were used in the calculation of semantic distances between keyword sets using the wmdistance method. The method observes the words individually and then as a part of a document. It creates a vector of the document and places it in an n-dimensional space, in relation to other document vectors after which is measures the distance between them. The result is a numerical value between 0 and 1.5 where 0 means that the compared documents are identical, and values over 1 describe documents than have no semantic connection. Preprocessing included separating the keyword sets into individual words, changing them to lowercase, removing any spaces and interpunction.
The semantic distances between keyword sets were constructed as a 730 by 730 matrix where all keyword sets were measured against all other keyword sets. The resulting matrix is symmetric, and the diagonal values are all equal to zero, which denotes maximum semantic similarity and occurs when comparing a keyword set with itself (overlapping vectors).
In brief, the dataset preparation followed these steps:
- Convert conference proceedings form PDF to plain text.
- Extract keywords using regular expressions.
- Build keyword dataset and save it as a tab separated plain text file. The file is designed as a table with the headings: article serial number/year of proceedings/keyword.
- Build keyword frequency data.
- Remove ‘crisis’ and ‘crises’ from the dataset due to high frequency.
- Use word2vec, a Gensim library, to create a vector dataset of keywords.
4. Semantic network graph generation
Main building blocks of the analysed dataset are keywords. A keyword, in the domain of academic writing, has many definitions but most agree that it is a word or a phrase which describes the topic of the document it is assigned to in a clear and succinct way (Lardera & Hjorland, 2021). Focusing only on keywords reduces computer processing requirements and bypasses the need to vectorise and model entire documents (Weismayer & Pezenka, 2017b). However, it should be taken into account that the keywords are not always the best representatives of an article's topic as sometimes authors do not follow the guidelines for creating keywords. Additionally, it should be noted that more important data can be gained from the analysis of larger texts which can lead to more accurate and complex results. This research attempt is deliberately focused on keywords as it tries to establish their information value in understanding main topics and trends in crisis management research on the example of one long-running conference.
As described in the previous chapter, a dataset of vector distances between keyword sets was created using the Gensim library. The next step was to construct a semantic network graph. This was done using the NetworkX (Hagberg et al., 2008) and Matplotlib (Hunter, 2007) Python libraries. The dataset of vector distances was plotted onto a two-dimensional plain thus creating the network image. The image consists of nodes and edges which represent the keyword sets and the connections between them. Larger nodes have more numerous and stronger connections with other nodes. Stronger connections (shorter semantic distances) are represented by thicker edges connecting two nodes and the placement of the nodes themselves. A semantic network graph was created for the entire dataset and for each year while filtering out semantic distance values which equalled 0 and those over 1. Therefore, only distances in the (0 < d < 1) interval were considered. At this point it was noticed that the word “crisis” and its varieties was present in the keyword sets to such a degree that made visual analysis of the graphs very difficult as it affected the semantic distance value. It was therefore decided to remove the word from the keyword sets during the dataset preparation stage which resulted in much clearer graphs. The following step included the analysis of the frequency list and visual analysis of the semantic network graphs.
5. Results
As mentioned in the previous chapter, it was noticed that the keyword “crisis” and its varieties scored very highly on the frequency list. This can be seen when observing the frequency lists for each individual year and in the total frequency score in Table 1. This is not surprising, since it corresponds with the conference title and main topic. Additionally, many other keywords contain some form of the word “crisis”. However, the high frequency of these keywords reduces their informative value when analysing the overall keyword and topic distribution.
Table 1. – Number of keywords containing the word “crisis” or “crises”.
|
Year |
Occurrence of “cris[i|e]es” |
Year |
Occurrence of “cris[i|e]es” |
|
2011 |
38/209 (18%) |
2018 |
19/208 (9%) |
|
2012 |
24/152 (16%) |
2019 |
9/138 (7%) |
|
2013 |
51/346 (15%) |
2020 |
13/162 (8%) |
|
2014 |
59/406 (15%) |
2021 |
4/83 (5%) |
|
2015 |
46/374 (12%) |
2022 |
12/202 (6%) |
|
2016 |
48/318 (15%) |
2023 |
10/131 (8%) |
|
2017 |
15/296 (5%) |
TOTAL |
348/3025 (12%) |
The word “crises” or “crises” is found in 11.5 % of all individual keywords (348/3025). This has proven to be a problem in constructing a semantic network, especially in visual representation, because the high occurrence of the word reduces the distance between keyword vectors which makes them difficult to differentiate in graphs. The word “crisis” was therefore removed in the preprocessing stage from all keyword sets while other words were not disturbed.
Table 2. – Keywords with occurrence of 4 and higher in the overall dataset.
|
|
Year 2011-2023[2] |
||||||||||||
|
Keywords |
11 |
12 |
13 |
14 |
15 |
16 |
17 |
18 |
19 |
20 |
22 |
23 |
Total |
|
civil protection |
4 |
4 |
8 |
||||||||||
|
communication |
4 |
4 |
|||||||||||
|
crisis |
10 |
5 |
15 |
13 |
16 |
11 |
7 |
5 |
8 |
90 |
|||
|
crisis communication |
5 |
5 |
10 |
||||||||||
|
crisis management |
8 |
7 |
12 |
17 |
13 |
9 |
5 |
71 |
|||||
|
critical infrastructure |
7 |
9 |
4 |
4 |
24 |
||||||||
|
disaster |
7 |
7 |
|||||||||||
|
disasters |
4 |
4 |
|||||||||||
|
environment |
5 |
5 |
10 |
||||||||||
|
management |
4 |
5 |
4 |
4 |
17 |
||||||||
|
national security |
4 |
4 |
|||||||||||
|
prevention |
4 |
6 |
10 |
||||||||||
|
protection |
5 |
5 |
|||||||||||
|
risk |
4 |
4 |
4 |
5 |
4 |
21 |
|||||||
|
risk assessment |
5 |
5 |
|||||||||||
|
security |
6 |
8 |
4 |
6 |
10 |
5 |
4 |
4 |
47 |
||||
|
terrorism |
5 |
5 |
10 |
||||||||||
|
Total per year |
37 |
16 |
45 |
59 |
83 |
26 |
39 |
10 |
4 |
4 |
16 |
8 |
347 |
Table 2 presents keywords which occurred 4 or more times in any proceedings year. Already we can notice a more homogenous distribution in years 2011-2017. Proceedings of the 2021 conference are not present here as there were no keywords which occurred 4 or more times. The 2021 conference proceeding has the fewest papers and only 17 sets of keywords in English.
|
2011 
|
2012 
|
2013 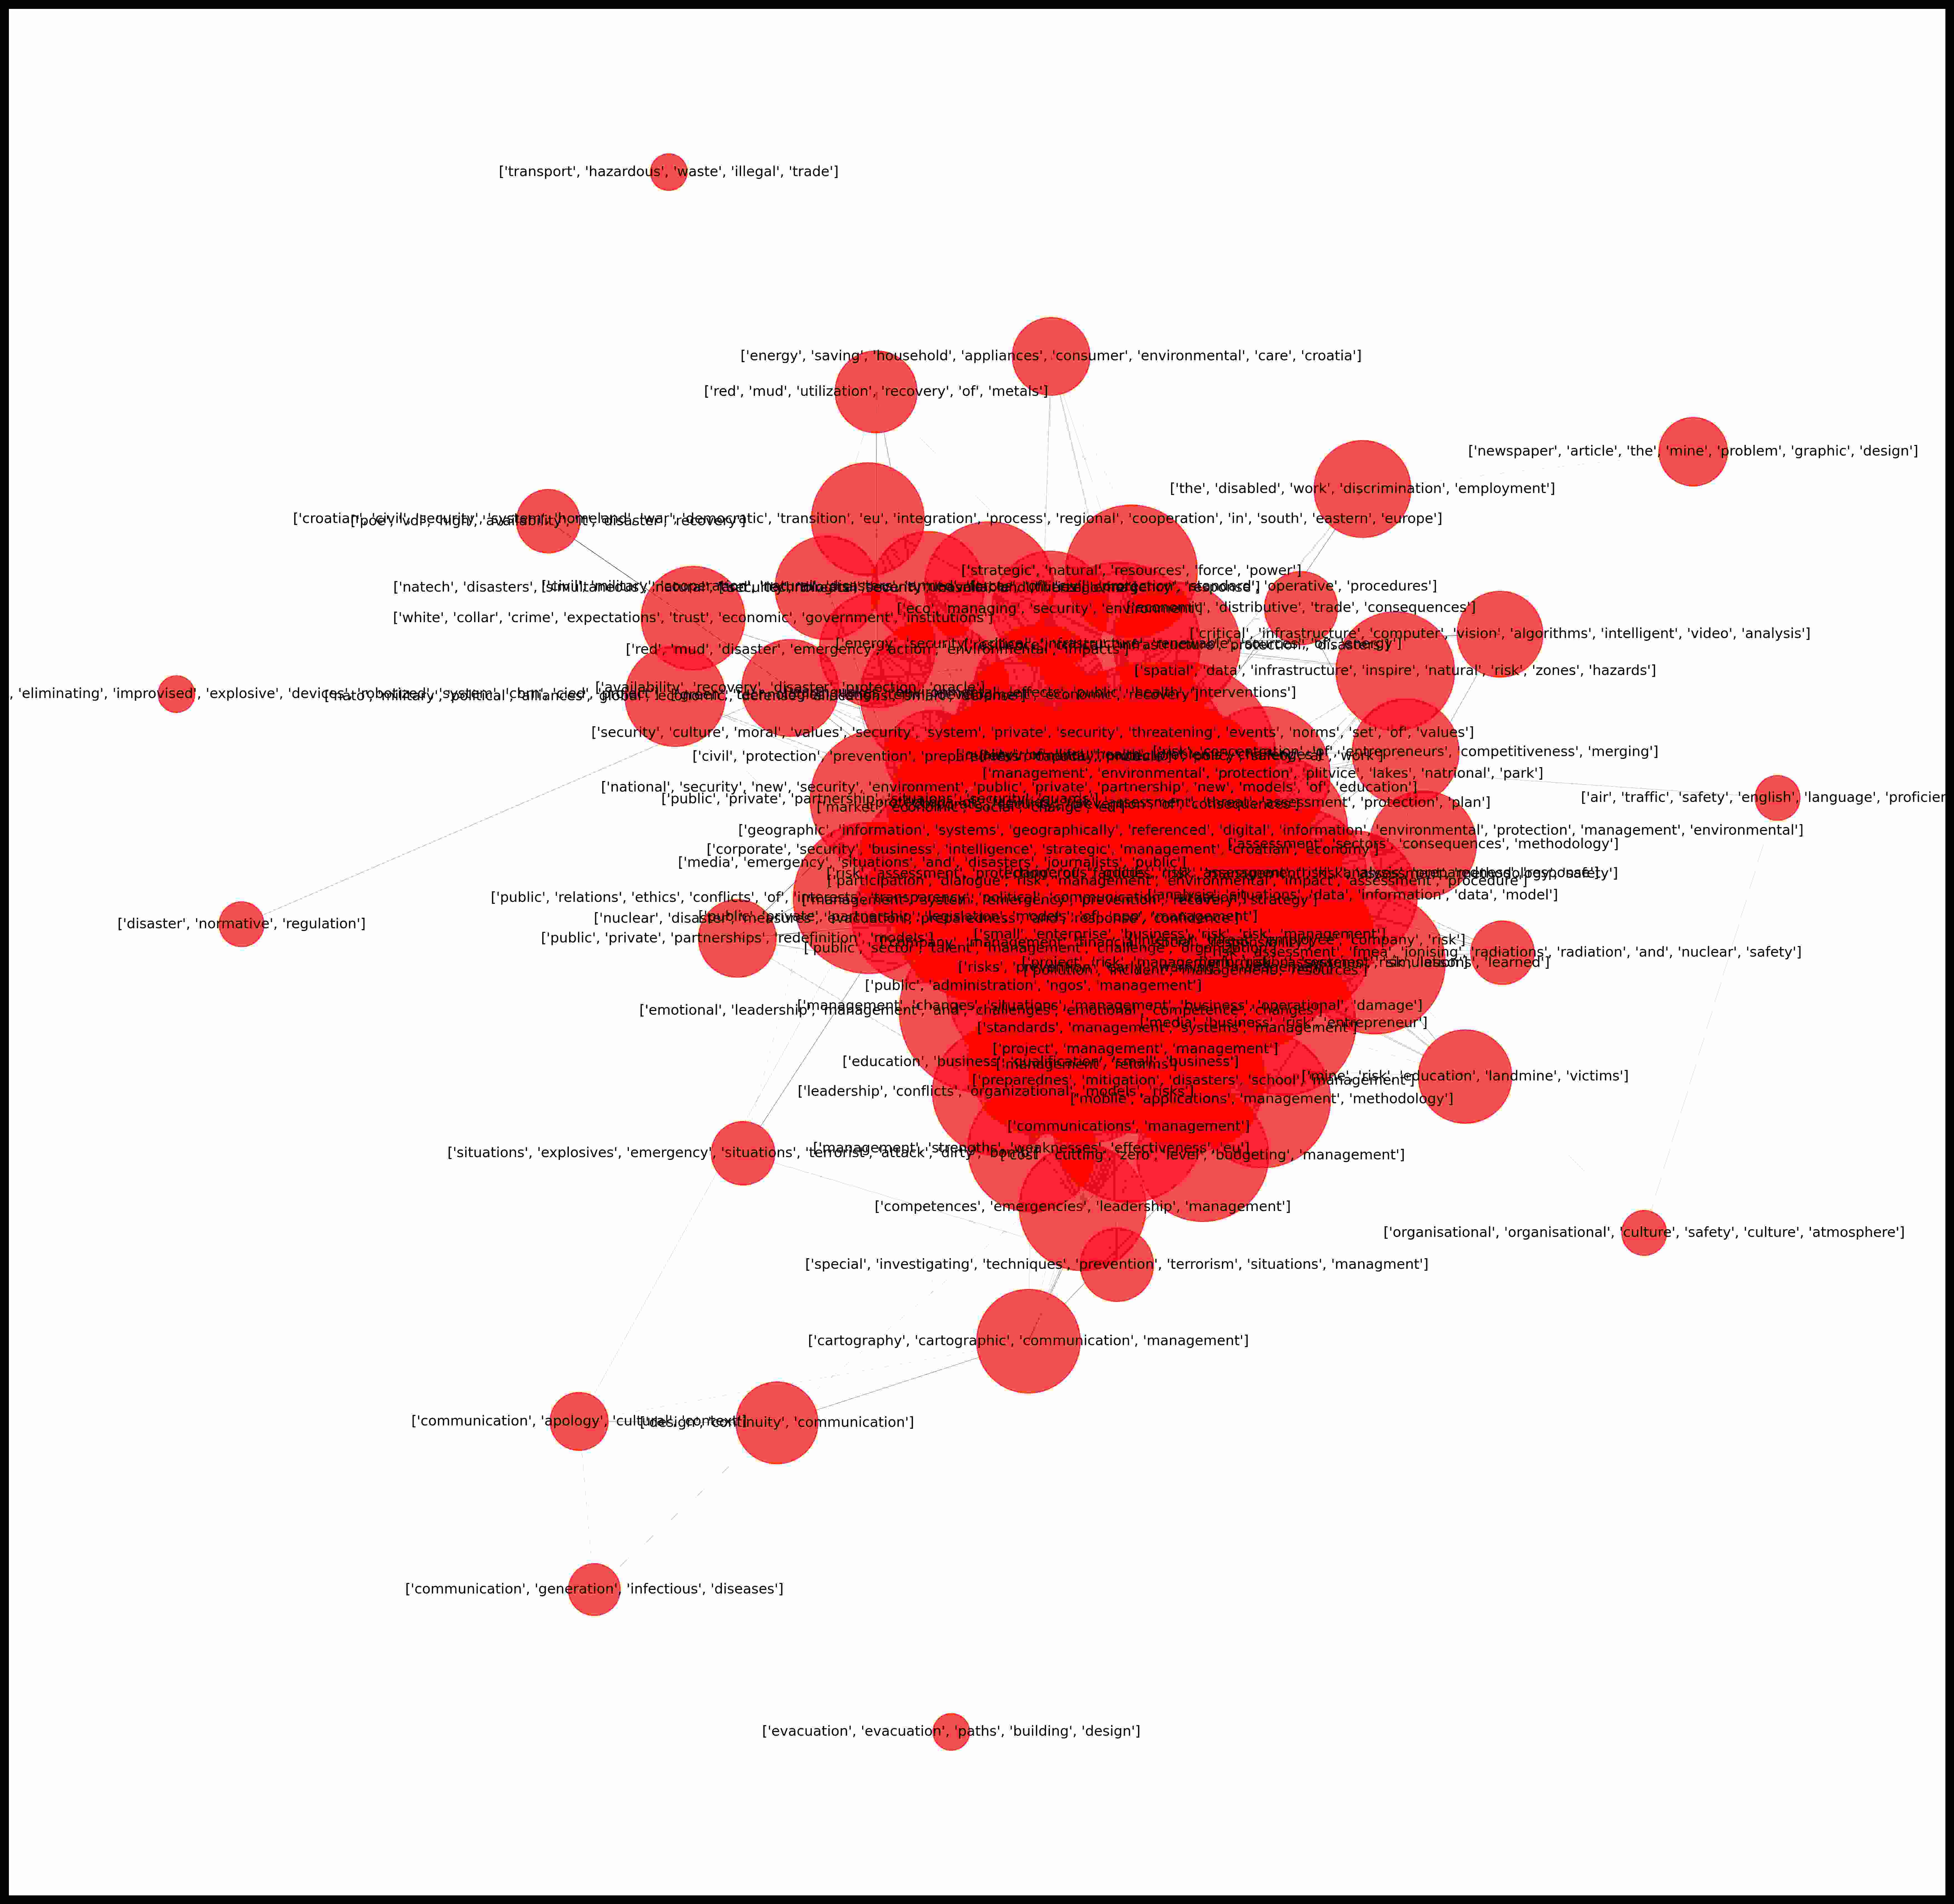
|
|
2014 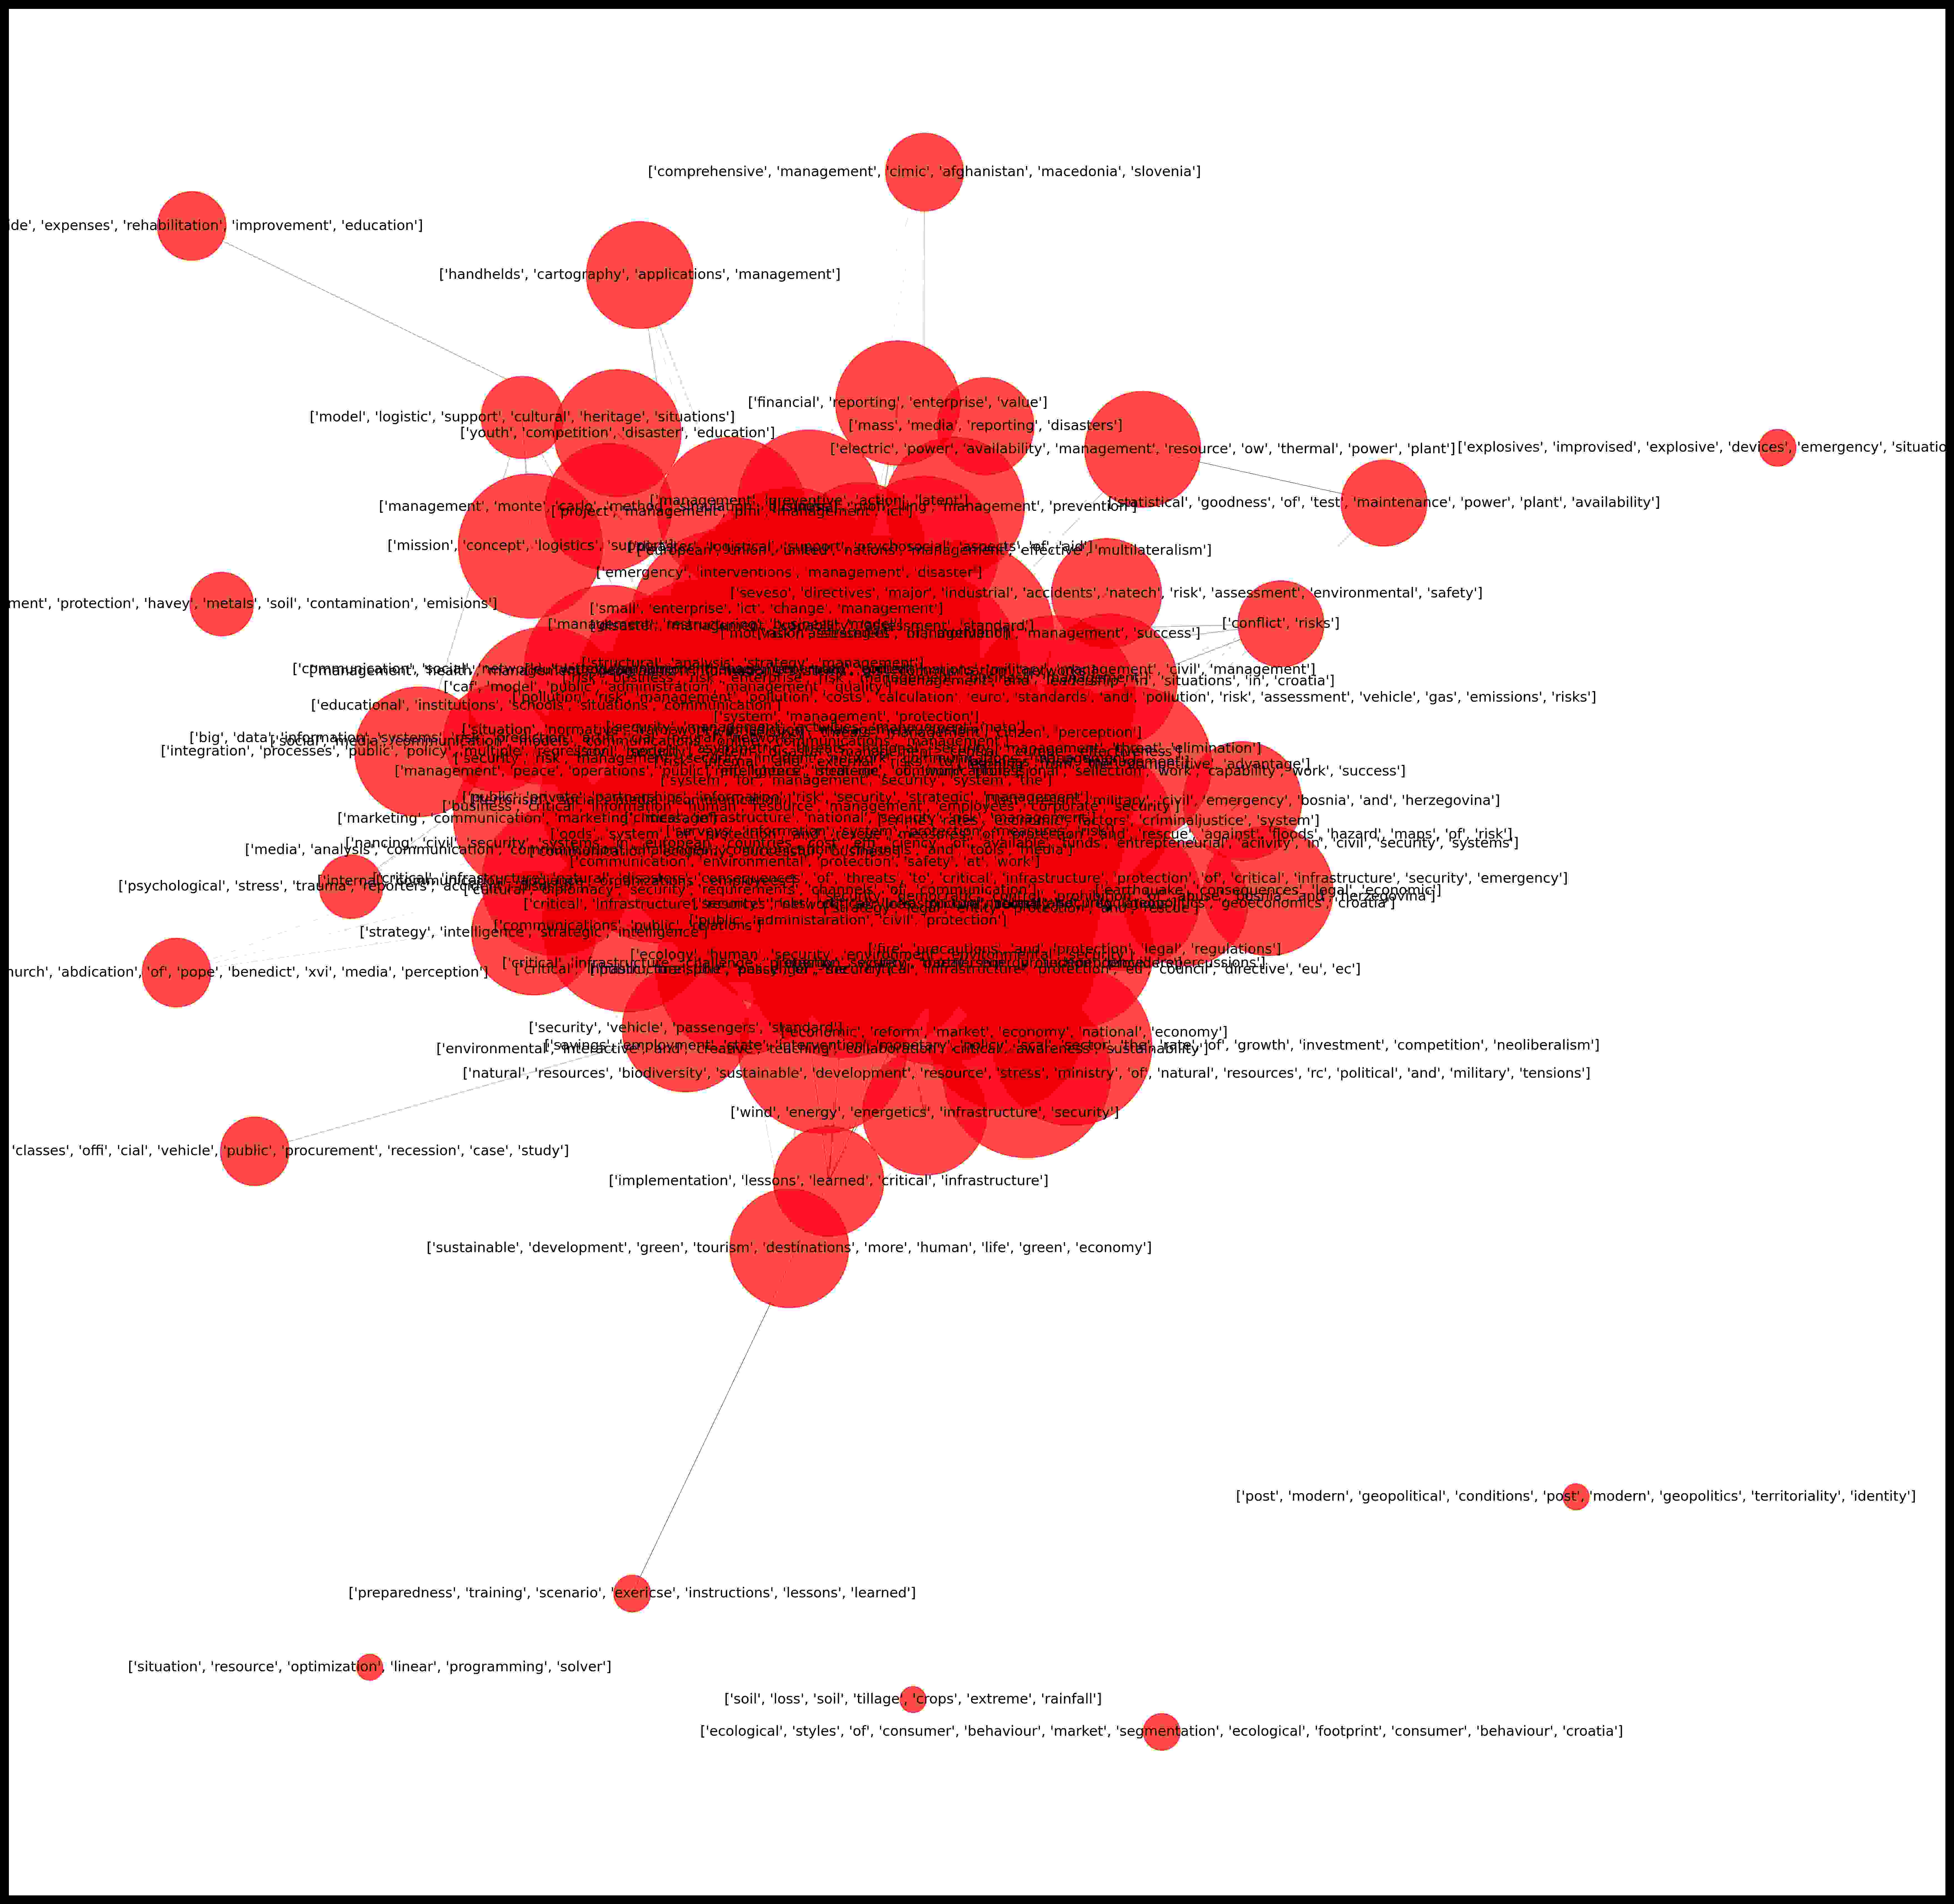
|
2015 
|
2016 
|
|
2017 
|
2018 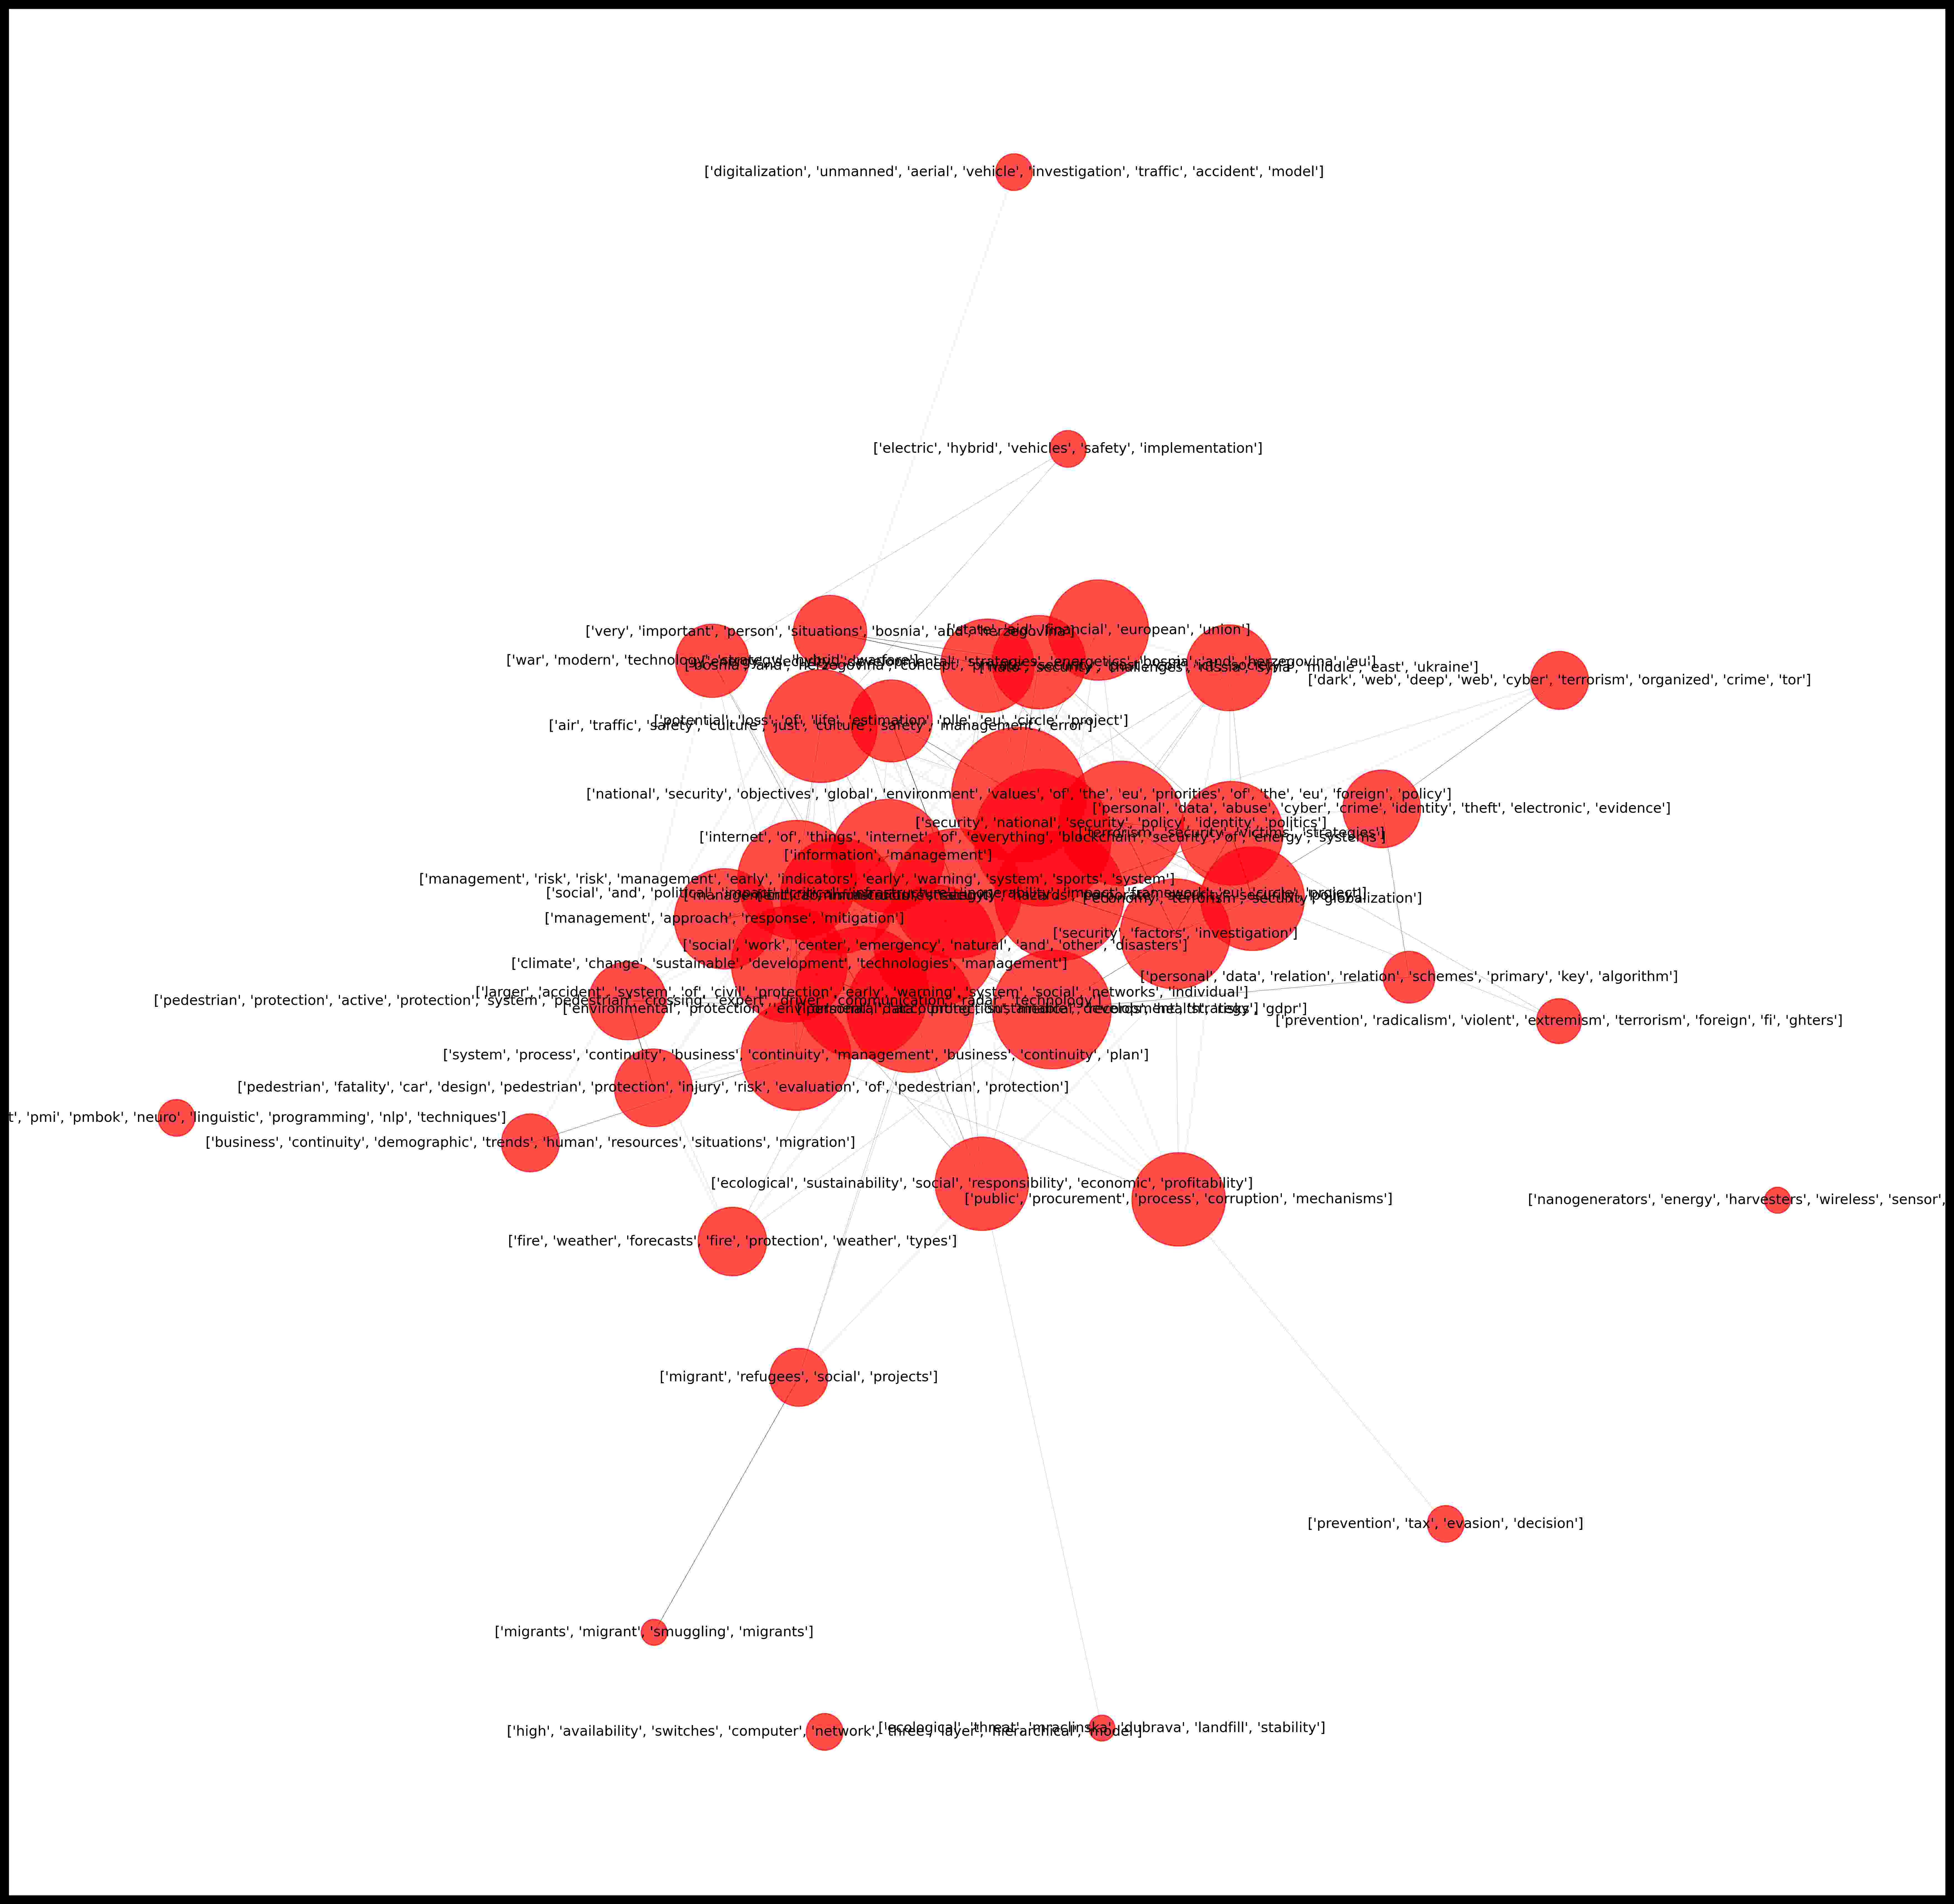
|
2019 
|
Figure 1. – Overview of semantic network graphs of keywords in conference proceedings from 2011 to 2019
Figure 1 contains the semantic network graphs for years 2011 to 2019. The shapes of graphs clearly show the keyword distribution. Years 2013 to 2017 show a more homogeneous distribution while other years contain more scattered keyword sets. While looking at conference topics and the 2013-2017 graphs, it can be surmised that most papers dealt with semantically closer topics.
|
2020 
|
2021 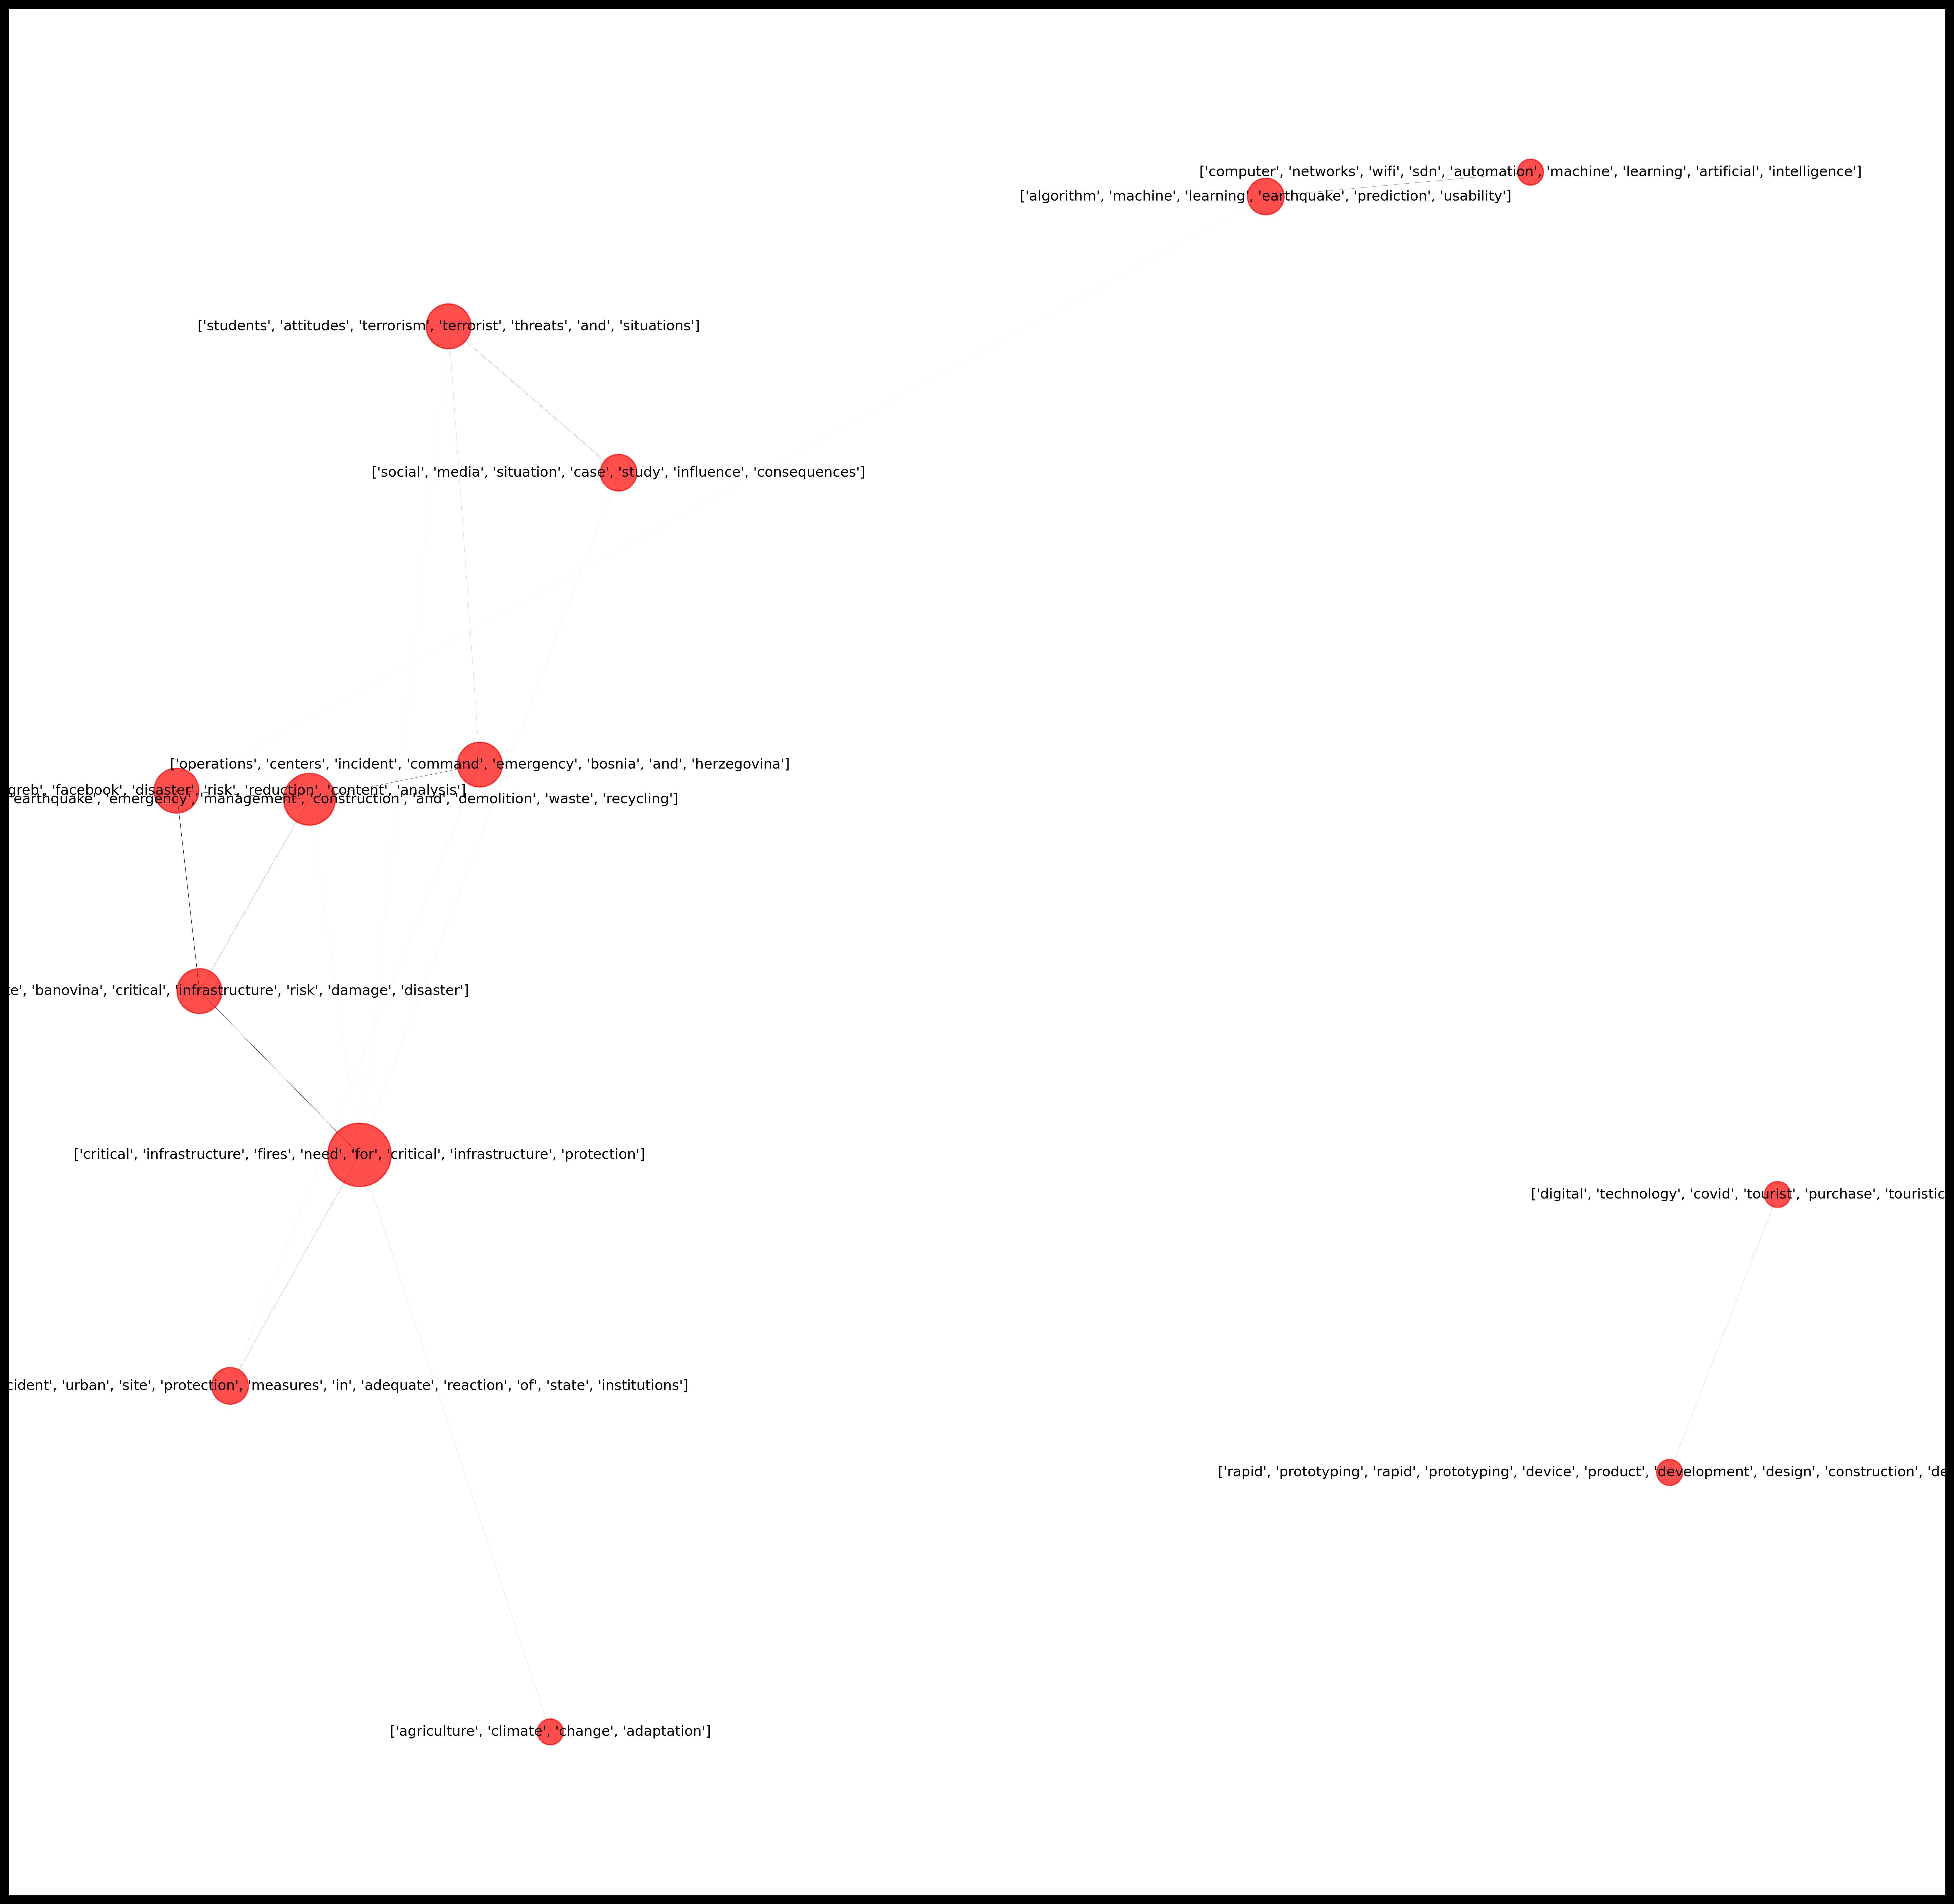
|
|
2022 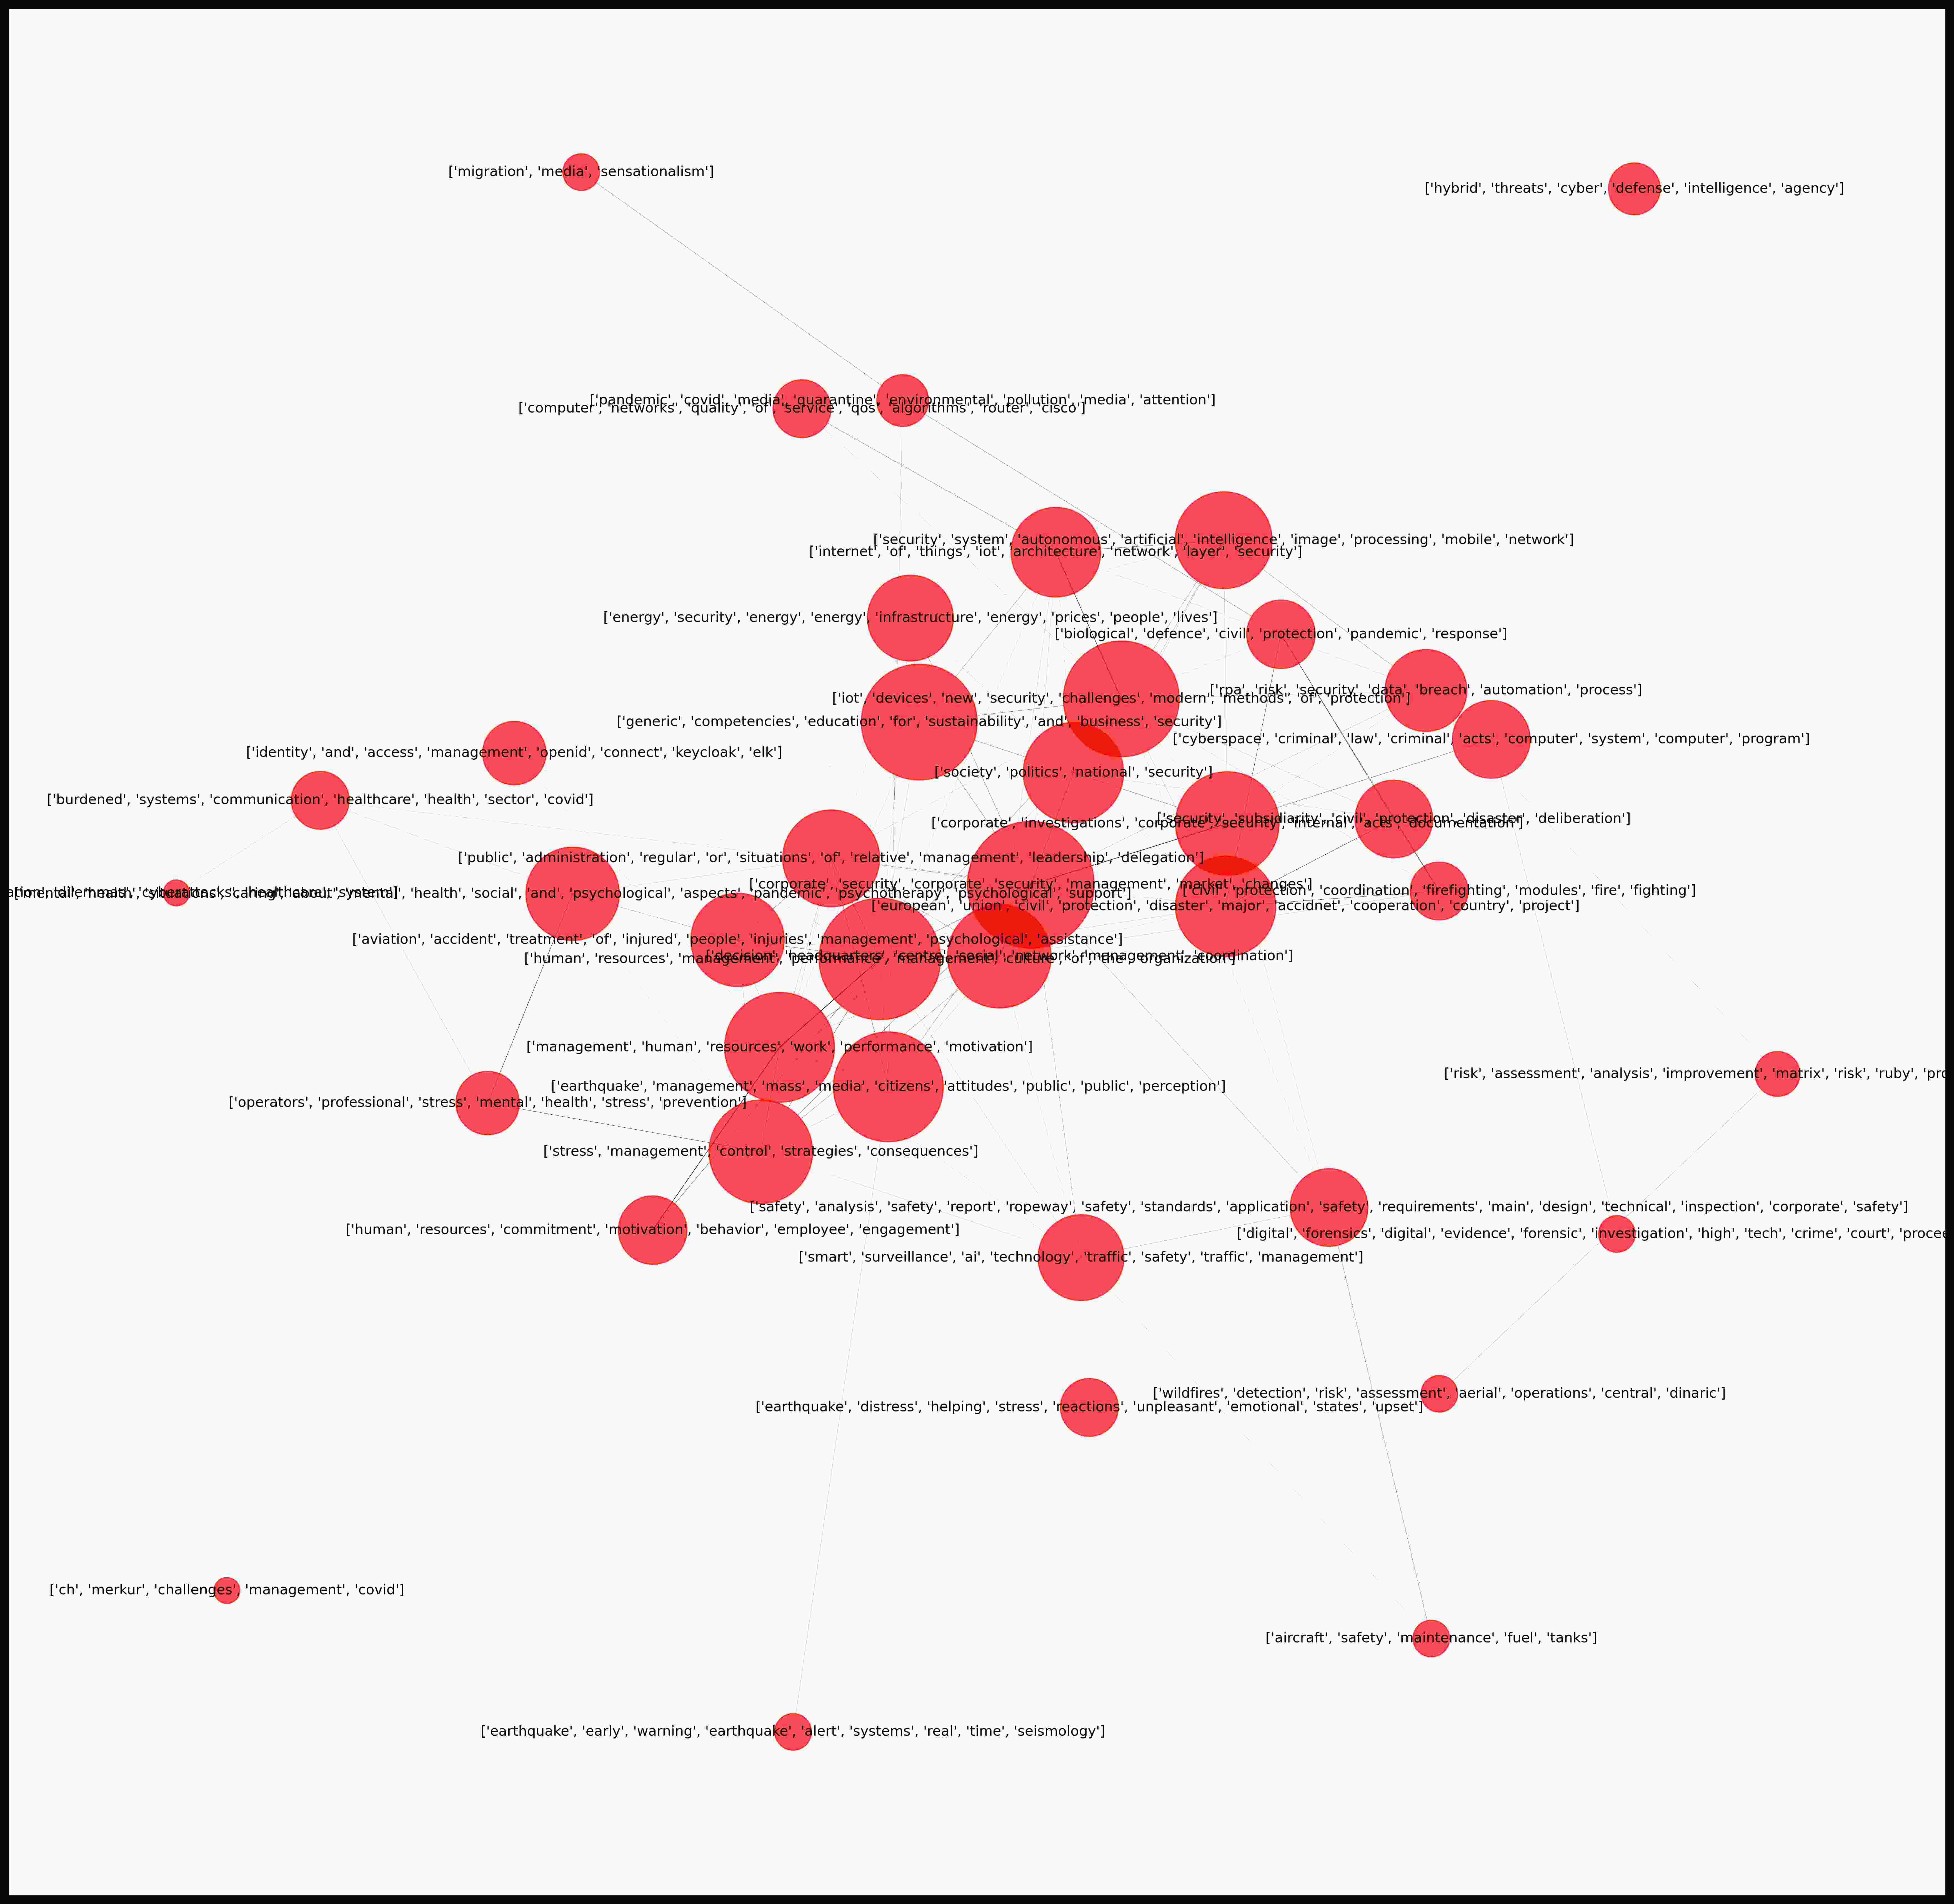
|
2023 
|
Figure 2. – Overview of semantic network graphs of keywords in conference proceedings from 2020 to 2023
Figure 2 displays the semantic network graphs for years 2020 to 2023 which have been intentionally separated from earlier years presented in Figure 1. The number of articles in these years is somewhat lower than in the previous period (one can assume that the conference suffered lower attendance numbers during the pandemic years 2020-2022). However, lower number of published articles makes for a less cluttered graph. It is especially interesting to look at the graph for 2021 with its low number of articles/keyword sets which are clearly grouped into several small clusters.
Figure 3. – Semantic network graphs of keywords in the 2012 conference proceedings
Figure 3 is a good example of the connections and clustering of keyword sets reflecting the conference topics which were more broadly defined this time. Conference topics for 2012 were:
- European union and crisis management
- Crisis management and contemporary threats
- Crisis management policies
- Crisis communication
- Critical infrastructure protection
- Risk management
- Public services in crisis management
- Modern business and crises
- IT and new crises
- National crisis management systems
In comparison, the topics for 2015, which can be seen in Figure 4, were:
- Contemporary Security Challenges
- Private Sector, Public Sector and Critical Infrastructures
- Management in Crises
- Crisis Communication
- Environmental Safety
- Lessons Learned and Reform Policies
Apart from being fewer in number, conference topics in 2015 seem closer related which can be seen in the semantic network graph displayed in Figure 4.
While looking at the semantic network graphs of keyword sets for the proceedings of the Crisis Management Days conference, it can be concluded that there is an overall tendency toward inclusion of a wider array of topics. However, it should be taken into account that in the 2020-2022 period, there was significantly lower number of keyword sets which corresponds to the lower number of published articles.
It should be noted here that the graphs could be further streamlined and adjusted by applying different filtering methods and modifying options of the matplotlib library used for creating them.
Figure 4. – Semantic network graphs of keywords in the 2015 conference proceedings
6. Conclusion
The presented results of the semantic network analysis show that the method is a valid tool for tracking and studying trends in a particular scientific area. The semantic network graphs are an intuitive visual tool which can be used for topic analysis, discovering new connections, and clustering topics on the basis of semantic distances between keywords. Using keywords reduces the computational load and the time required for processing. One additional benefit is that keywords are often available in English regardless of the publication’s main language, as is the case here.
Regarding the analysis of the keyword sets of the Crisis Management Days proceedings, certain trends can be noticed, such as the scattering of topics over the years. It is beyond the scope of this research to suggest what causes these trends, but there is hope that it might provide insight to other researchers in semantic networks, bibliometrics as well as the conference organisers and crisis management experts.
Further study should apply a wider approach by including other publications in the field of crisis management. Additionally, a comparison with another field of research could provide additional insight into the methodology and validate the results presented here. Next step in this line of research should try to use article abstracts to build the semantic network and compare the results to keyword based semantic networks.
7. References
González, L.-M., García-Massó, X., Pardo-Ibañez, A., Peset, F., & Devís-Devís, J. (2018). An author keyword analysis for mapping Sport Sciences. PLOS ONE, 13(8), e0201435. https://doi.org/10.1371/journal.pone.0201435
Hagberg, A. A., Schult, D. A., & Swart, P. J. (2008). Exploring Network Structure, Dynamics, and Function using NetworkX. In G. Varoquaux, T. Vaught, & J. Millman (Eds.), Proceedings of the 7th Python in Science Conference (SciPy2008) (pp. 11–15). https://conference.scipy.org/proceedings/SciPy2008/paper_2/
Hunter, J. D. (2007). Matplotlib: A 2D Graphics Environment. Computing in Science & Engineering, 9(3), 90–95. https://doi.org/10.1109/MCSE.2007.55
Lardera, M., & Hjorland, B. (2021). Keyword. KNOWLEDGE ORGANIZATION, 48(6), 430–456. https://doi.org/10.5771/0943-7444-2021-6-430
Manning, C. D., & Schütze, H. (1999). Foundations of statistical natural language processing. The MIT Press.
Pesta, B., Fuerst, J., & Kirkegaard, E. (2018). Bibliometric Keyword Analysis across Seventeen Years (2000–2016) of Intelligence Articles. Journal of Intelligence, 6(4), 46. https://doi.org/10.3390/jintelligence6040046
Řehůřek, R. (2022). Gensim. https://radimrehurek.com/gensim/
Řehůřek, R., & Sojka, P. (2010). Software Framework for Topic Modelling with Large Corpora. Proceedings of the LREC 2010 Workshop on New Challenges for NLP Frameworks, 45–50.
Song, Y., Liu, S., Liu, X., & Wang, H. (2015). Automatic Taxonomy Construction from Keywords via Scalable Bayesian Rose Trees. IEEE Transactions on Knowledge and Data Engineering, 27(7), 1861–1874. https://doi.org/10.1109/TKDE.2015.2397432
Sowa, J. F. (1991). TOWARD THE EXPRESSIVE POWER OF NATURAL LANGUAGE. In Principles of Semantic Networks (pp. 157–189). Elsevier. https://doi.org/10.1016/B978-1-4832-0771-1.50011-4
Su, H. N., & Lee, P. C. (2010). Mapping knowledge structure by keyword co-occurrence: A first look at journal papers in Technology Foresight. Scientometrics, 85(1), 65–79. https://doi.org/10.1007/s11192-010-0259-8
Tang, X., Zheng, Z., Li, J., Meng, F., Zhu, S.-C., Liang, Y., & Zhang, M. (2023). Large Language Models are In-Context Semantic Reasoners rather than Symbolic Reasoners.
Weismayer, C., & Pezenka, I. (2017a). Identifying emerging research fields: a longitudinal latent semantic keyword analysis. Scientometrics, 113(3), 1757–1785. https://doi.org/10.1007/s11192-017-2555-z
Weismayer, C., & Pezenka, I. (2017b). Identifying emerging research fields: a longitudinal latent semantic keyword analysis. Scientometrics, 113(3), 1757–1785. https://doi.org/10.1007/s11192-017-2555-z
[1] https://dku.hr/book-of-papers/?lang=en
[2] Data for 2021 is missing as no keyword sets occure 4 or more times
Copyright (c) Annals of Disaster Risk Sciences

This work is licensed under a Creative Commons Attribution 4.0 International License.